

Request a free quote.
Financial Dashboard
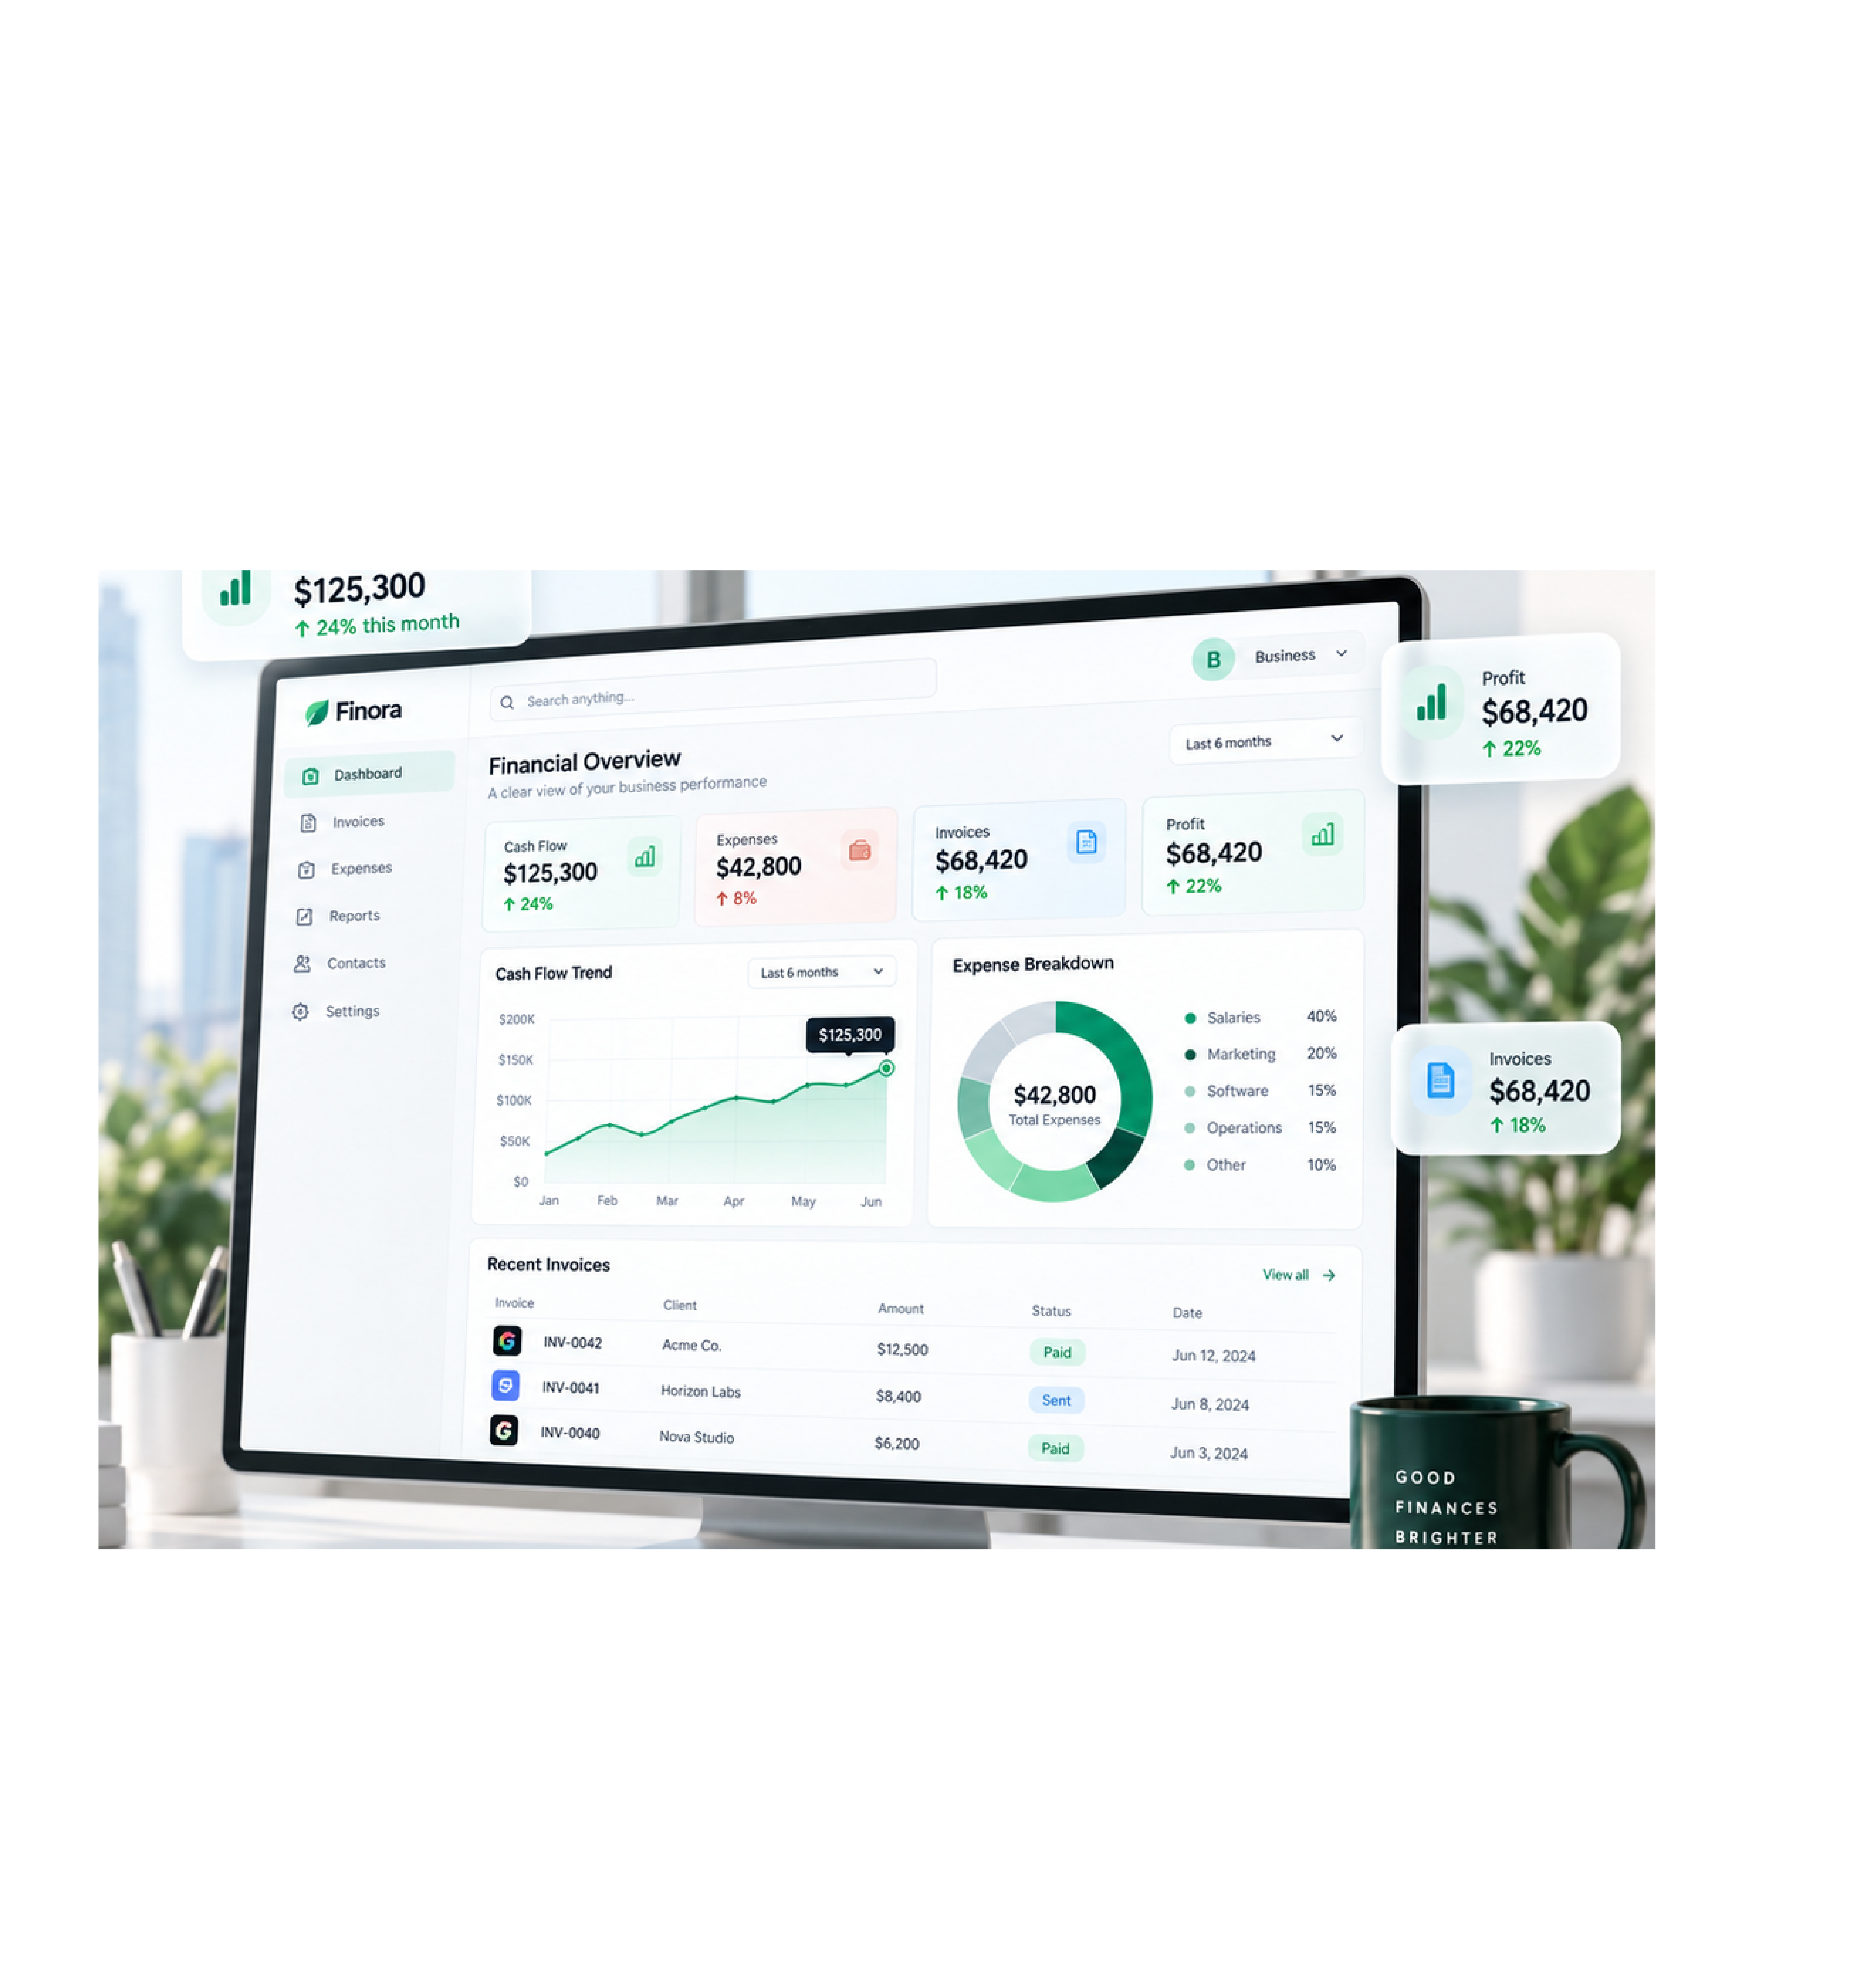
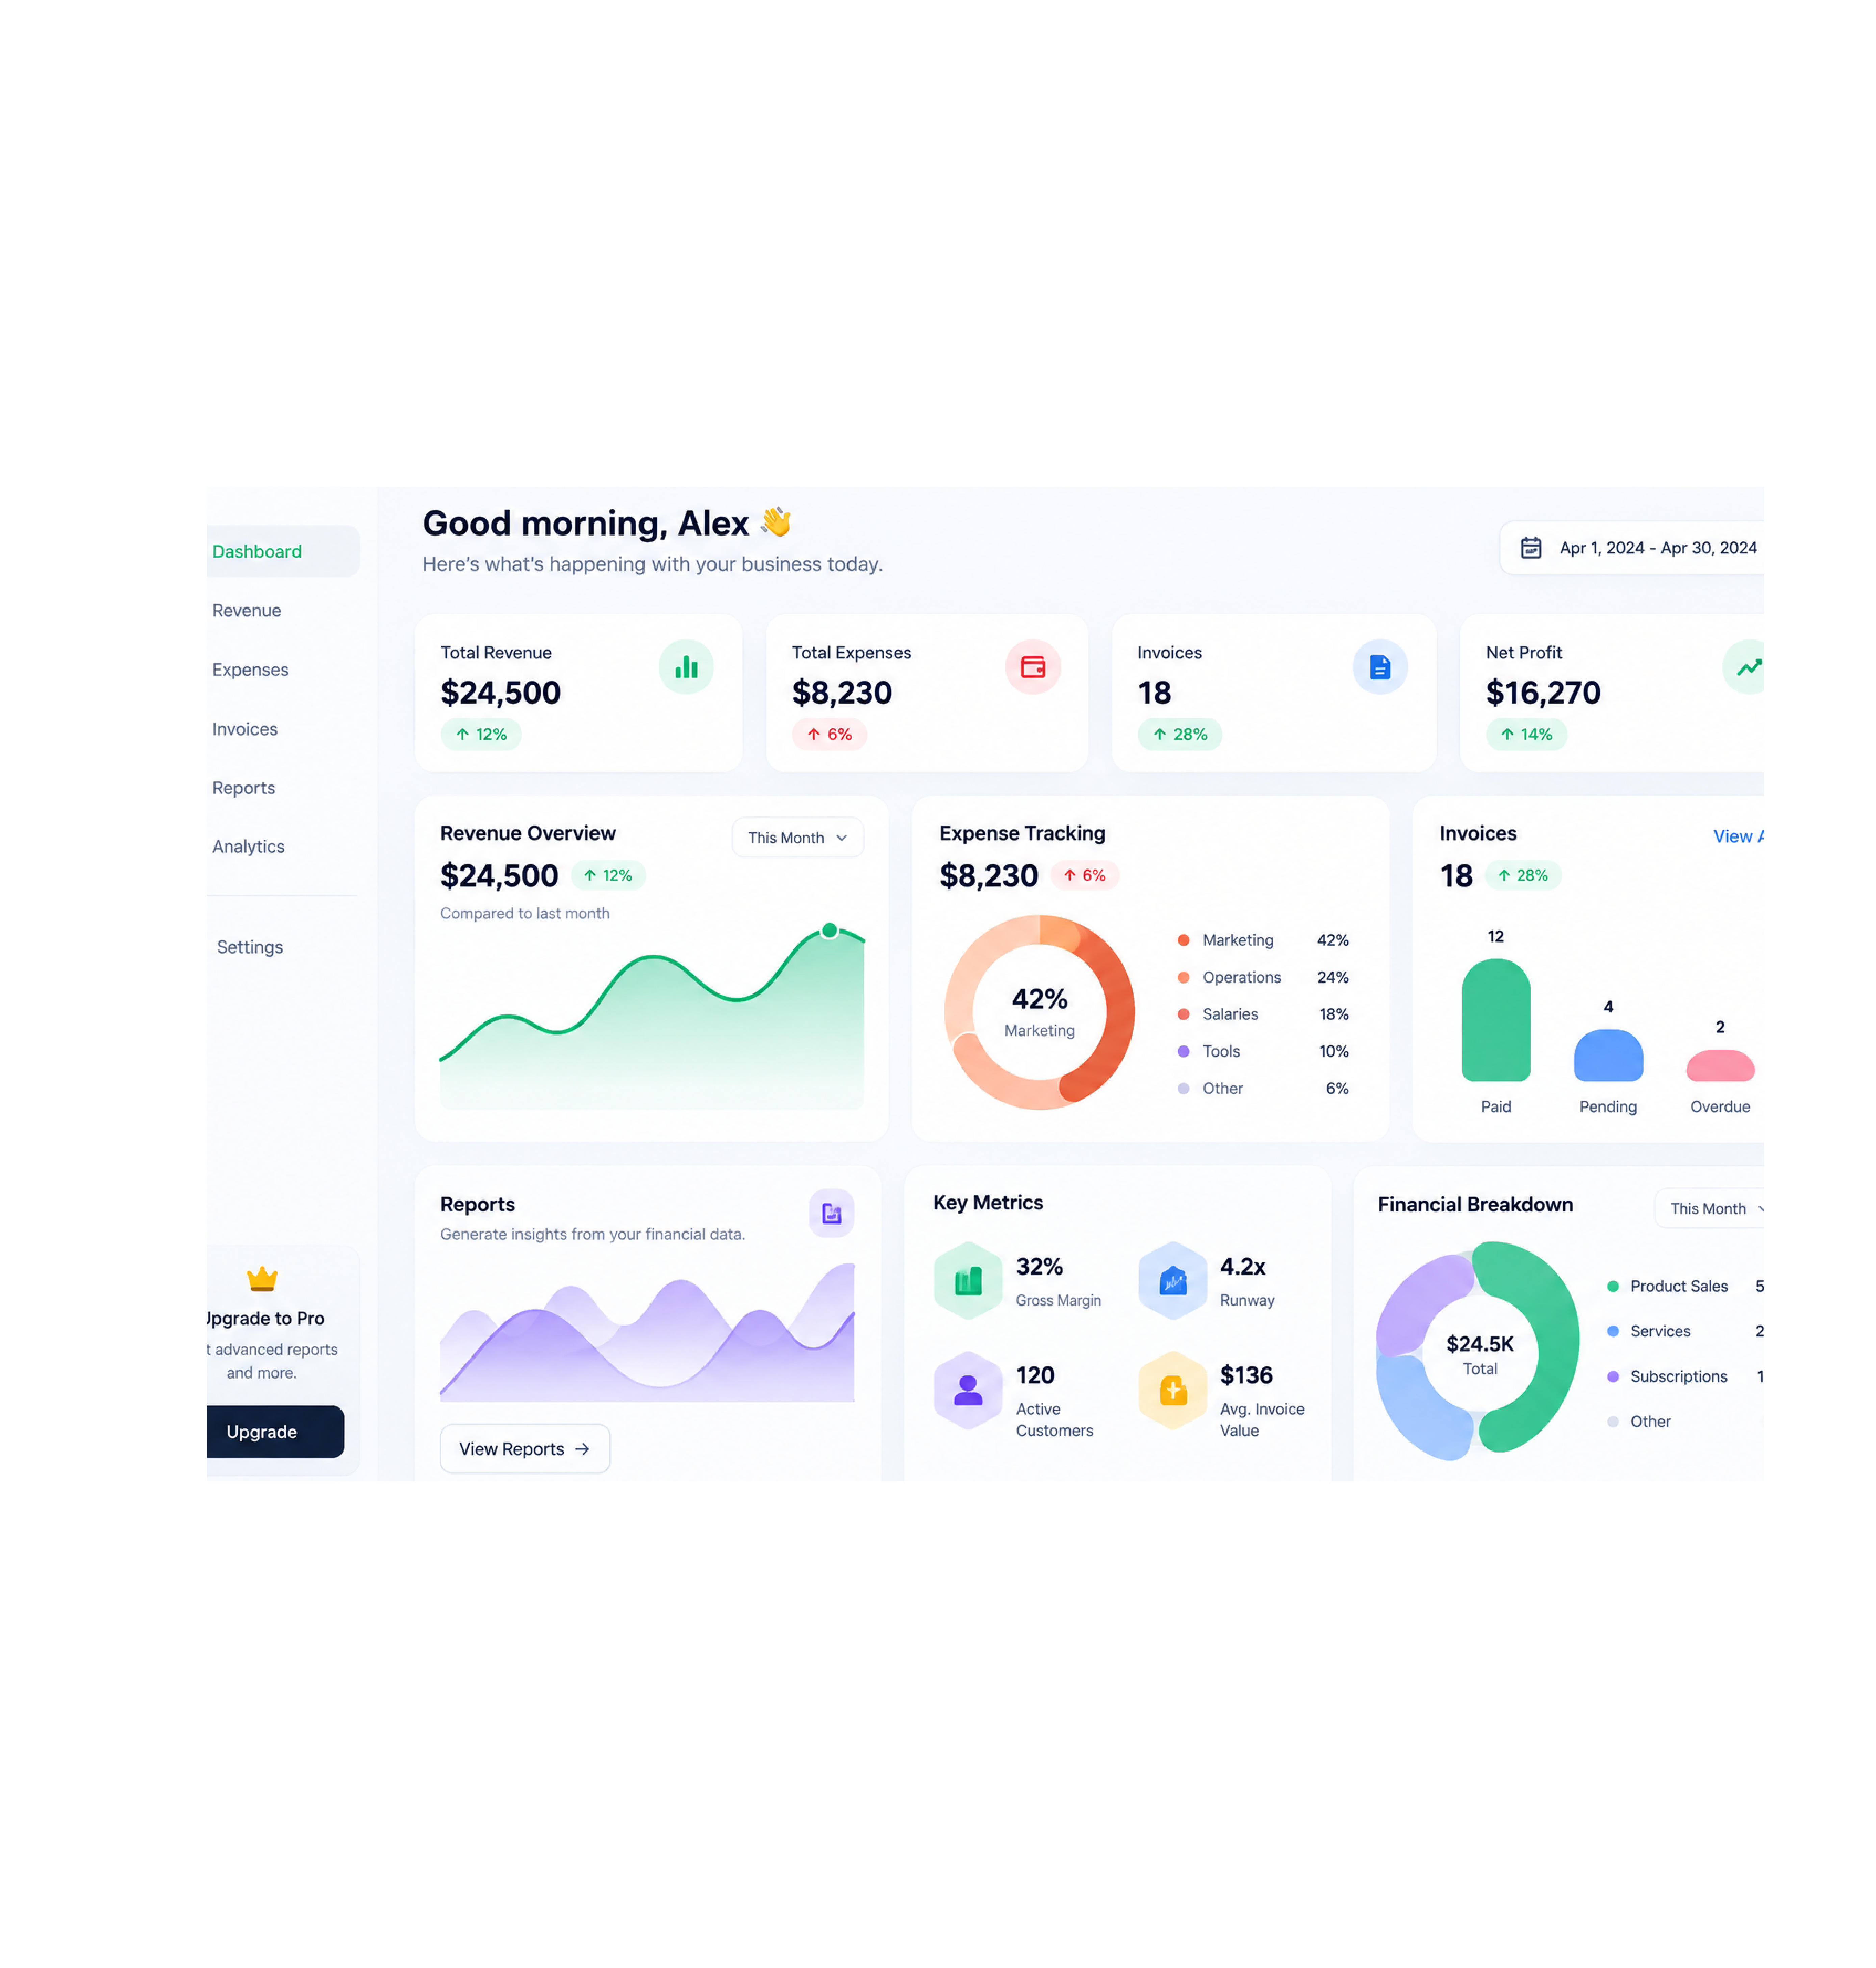
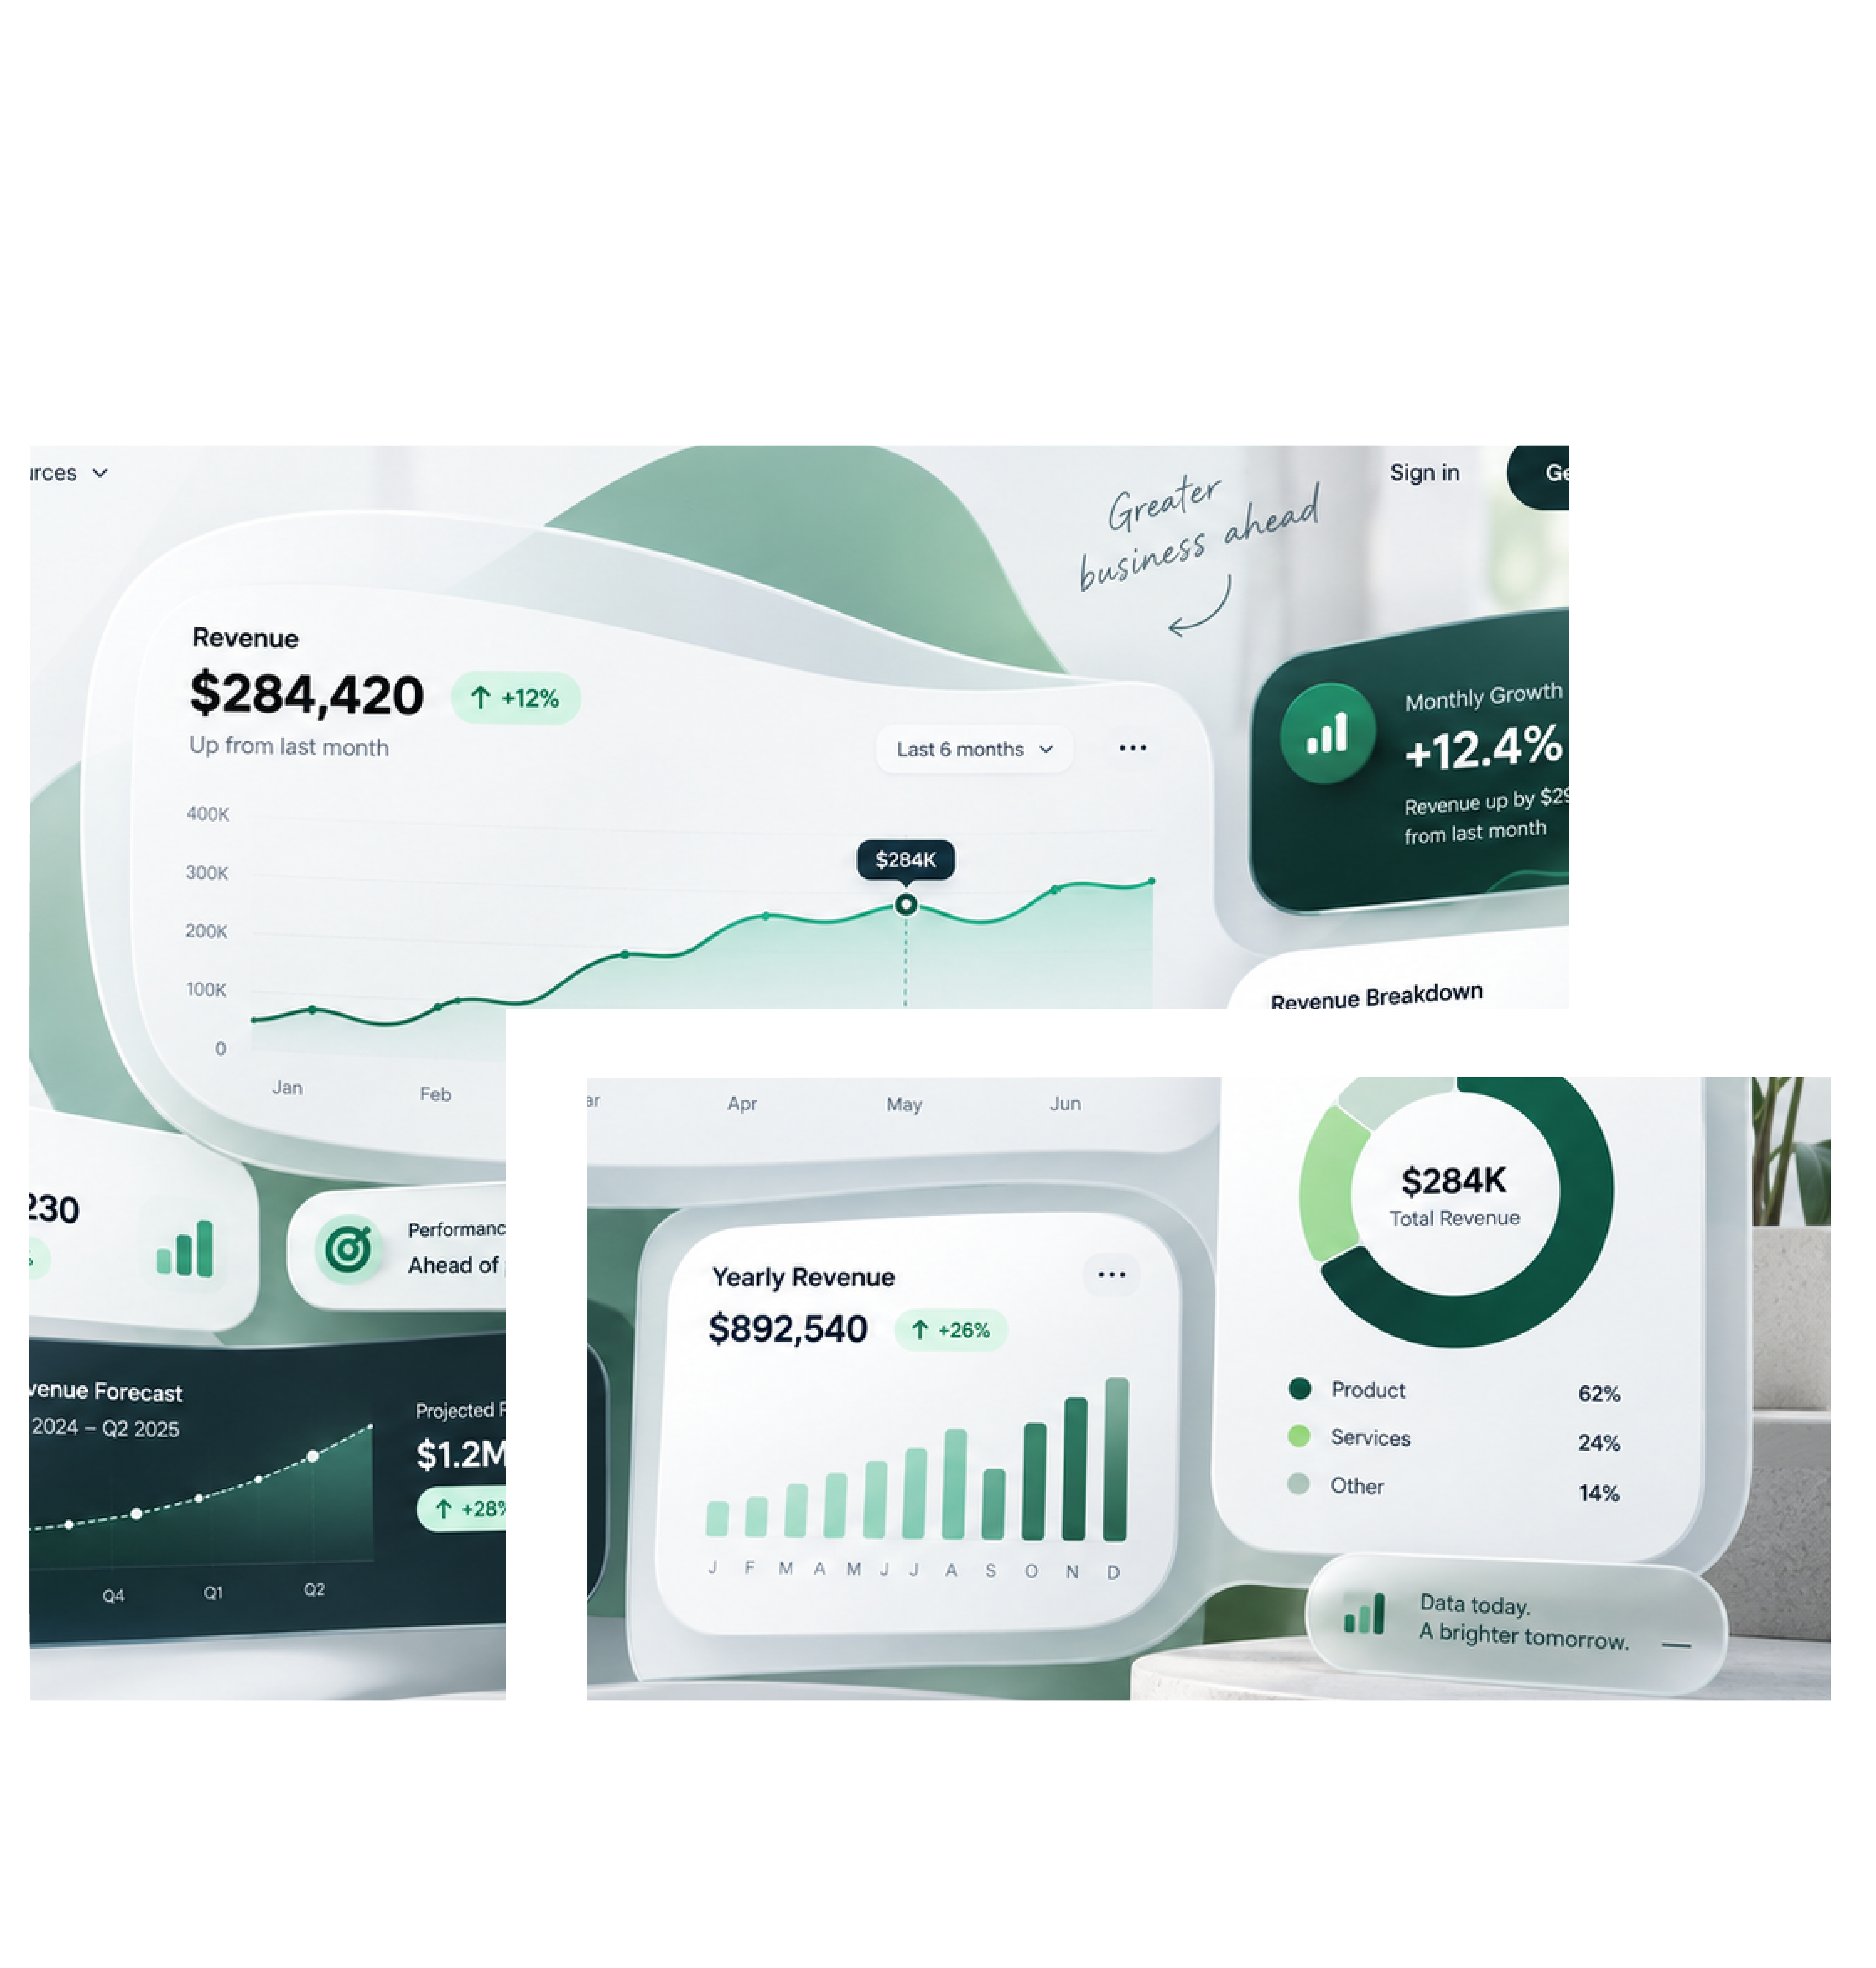
Finora’s Financial Dashboard gives you a clear, real-time view of your company’s financial health. Track revenue, expenses, cash flow, profit margins, and key financial KPIs in one interactive screen. With smart visualizations and instant updates, you can quickly spot trends, monitor performance, and make confident financial decisions without digging through spreadsheets. It’s designed to keep your finances transparent, organized, and always under control.
Advanced Analytics & Insights
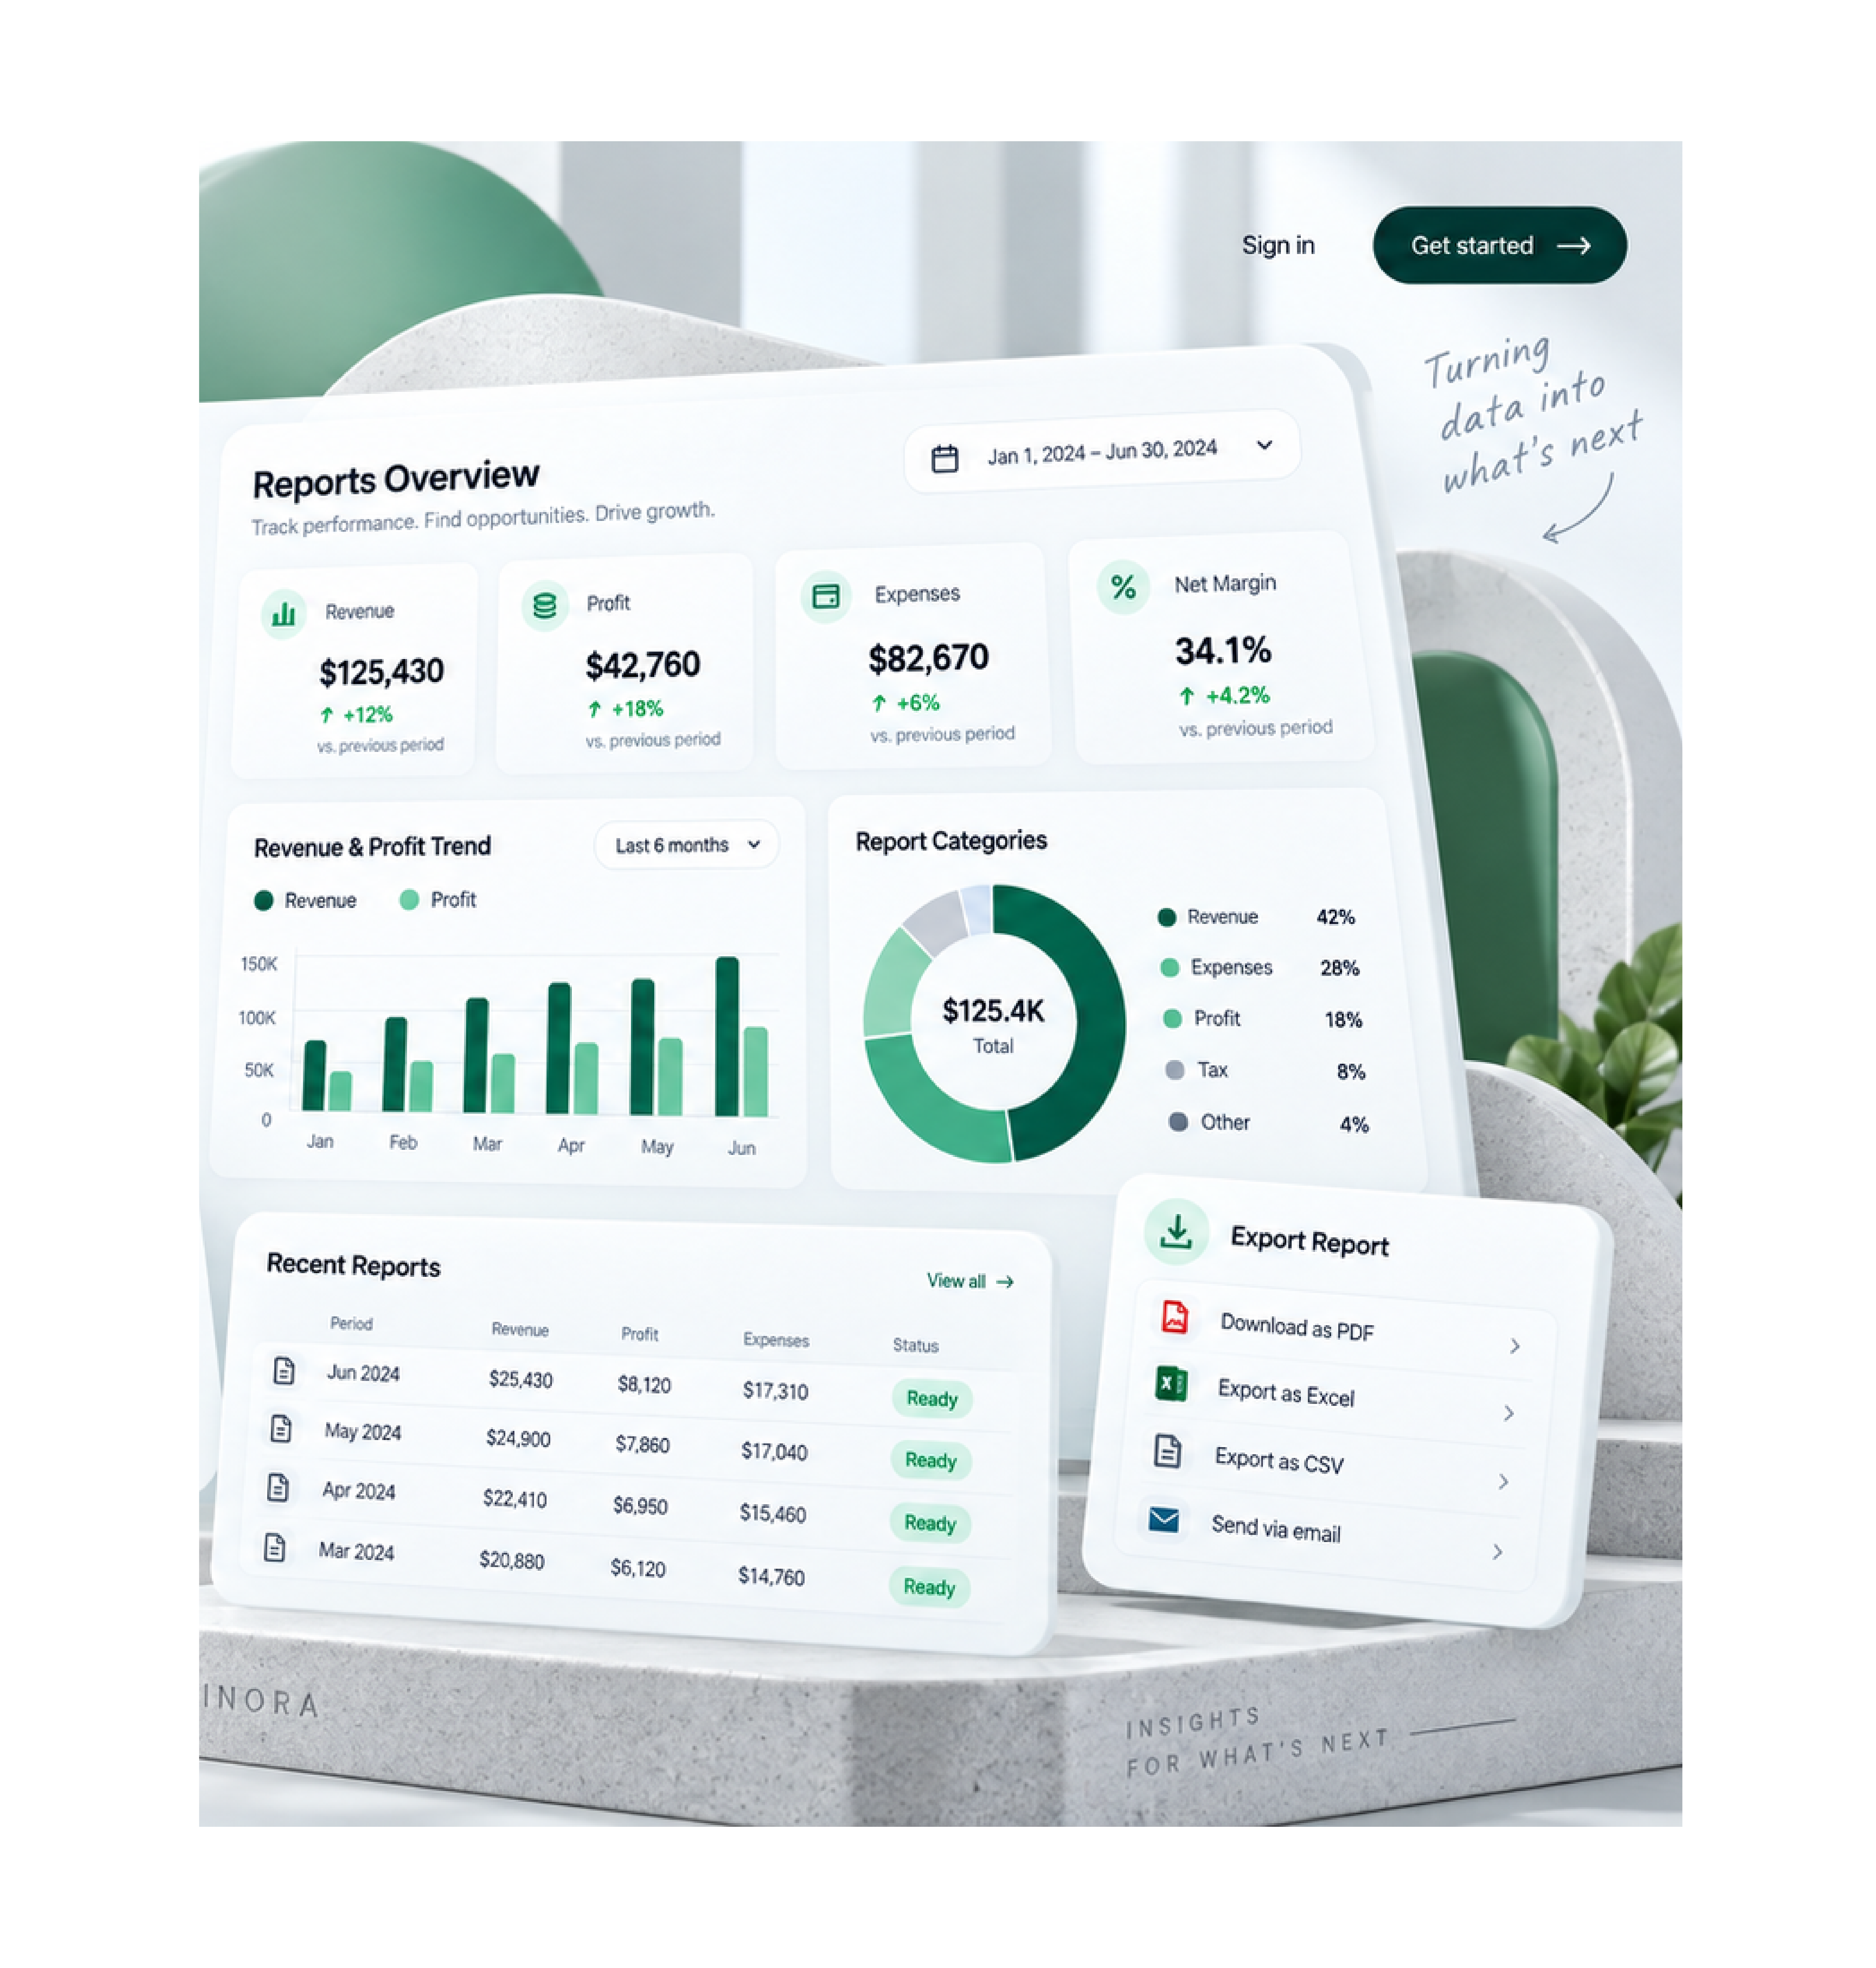
Finora’s Advanced Analytics service takes your data beyond basic reports. It uses smart algorithms to uncover hidden patterns, predict future trends, and deliver deeper business insights automatically. From sales forecasting to customer behavior analysis, you get clear, actionable intelligence that helps you make proactive decisions and stay ahead of the market — all without needing a data science team.
Layouts
50+ Screens
About the Finora Business Intelligence Saas
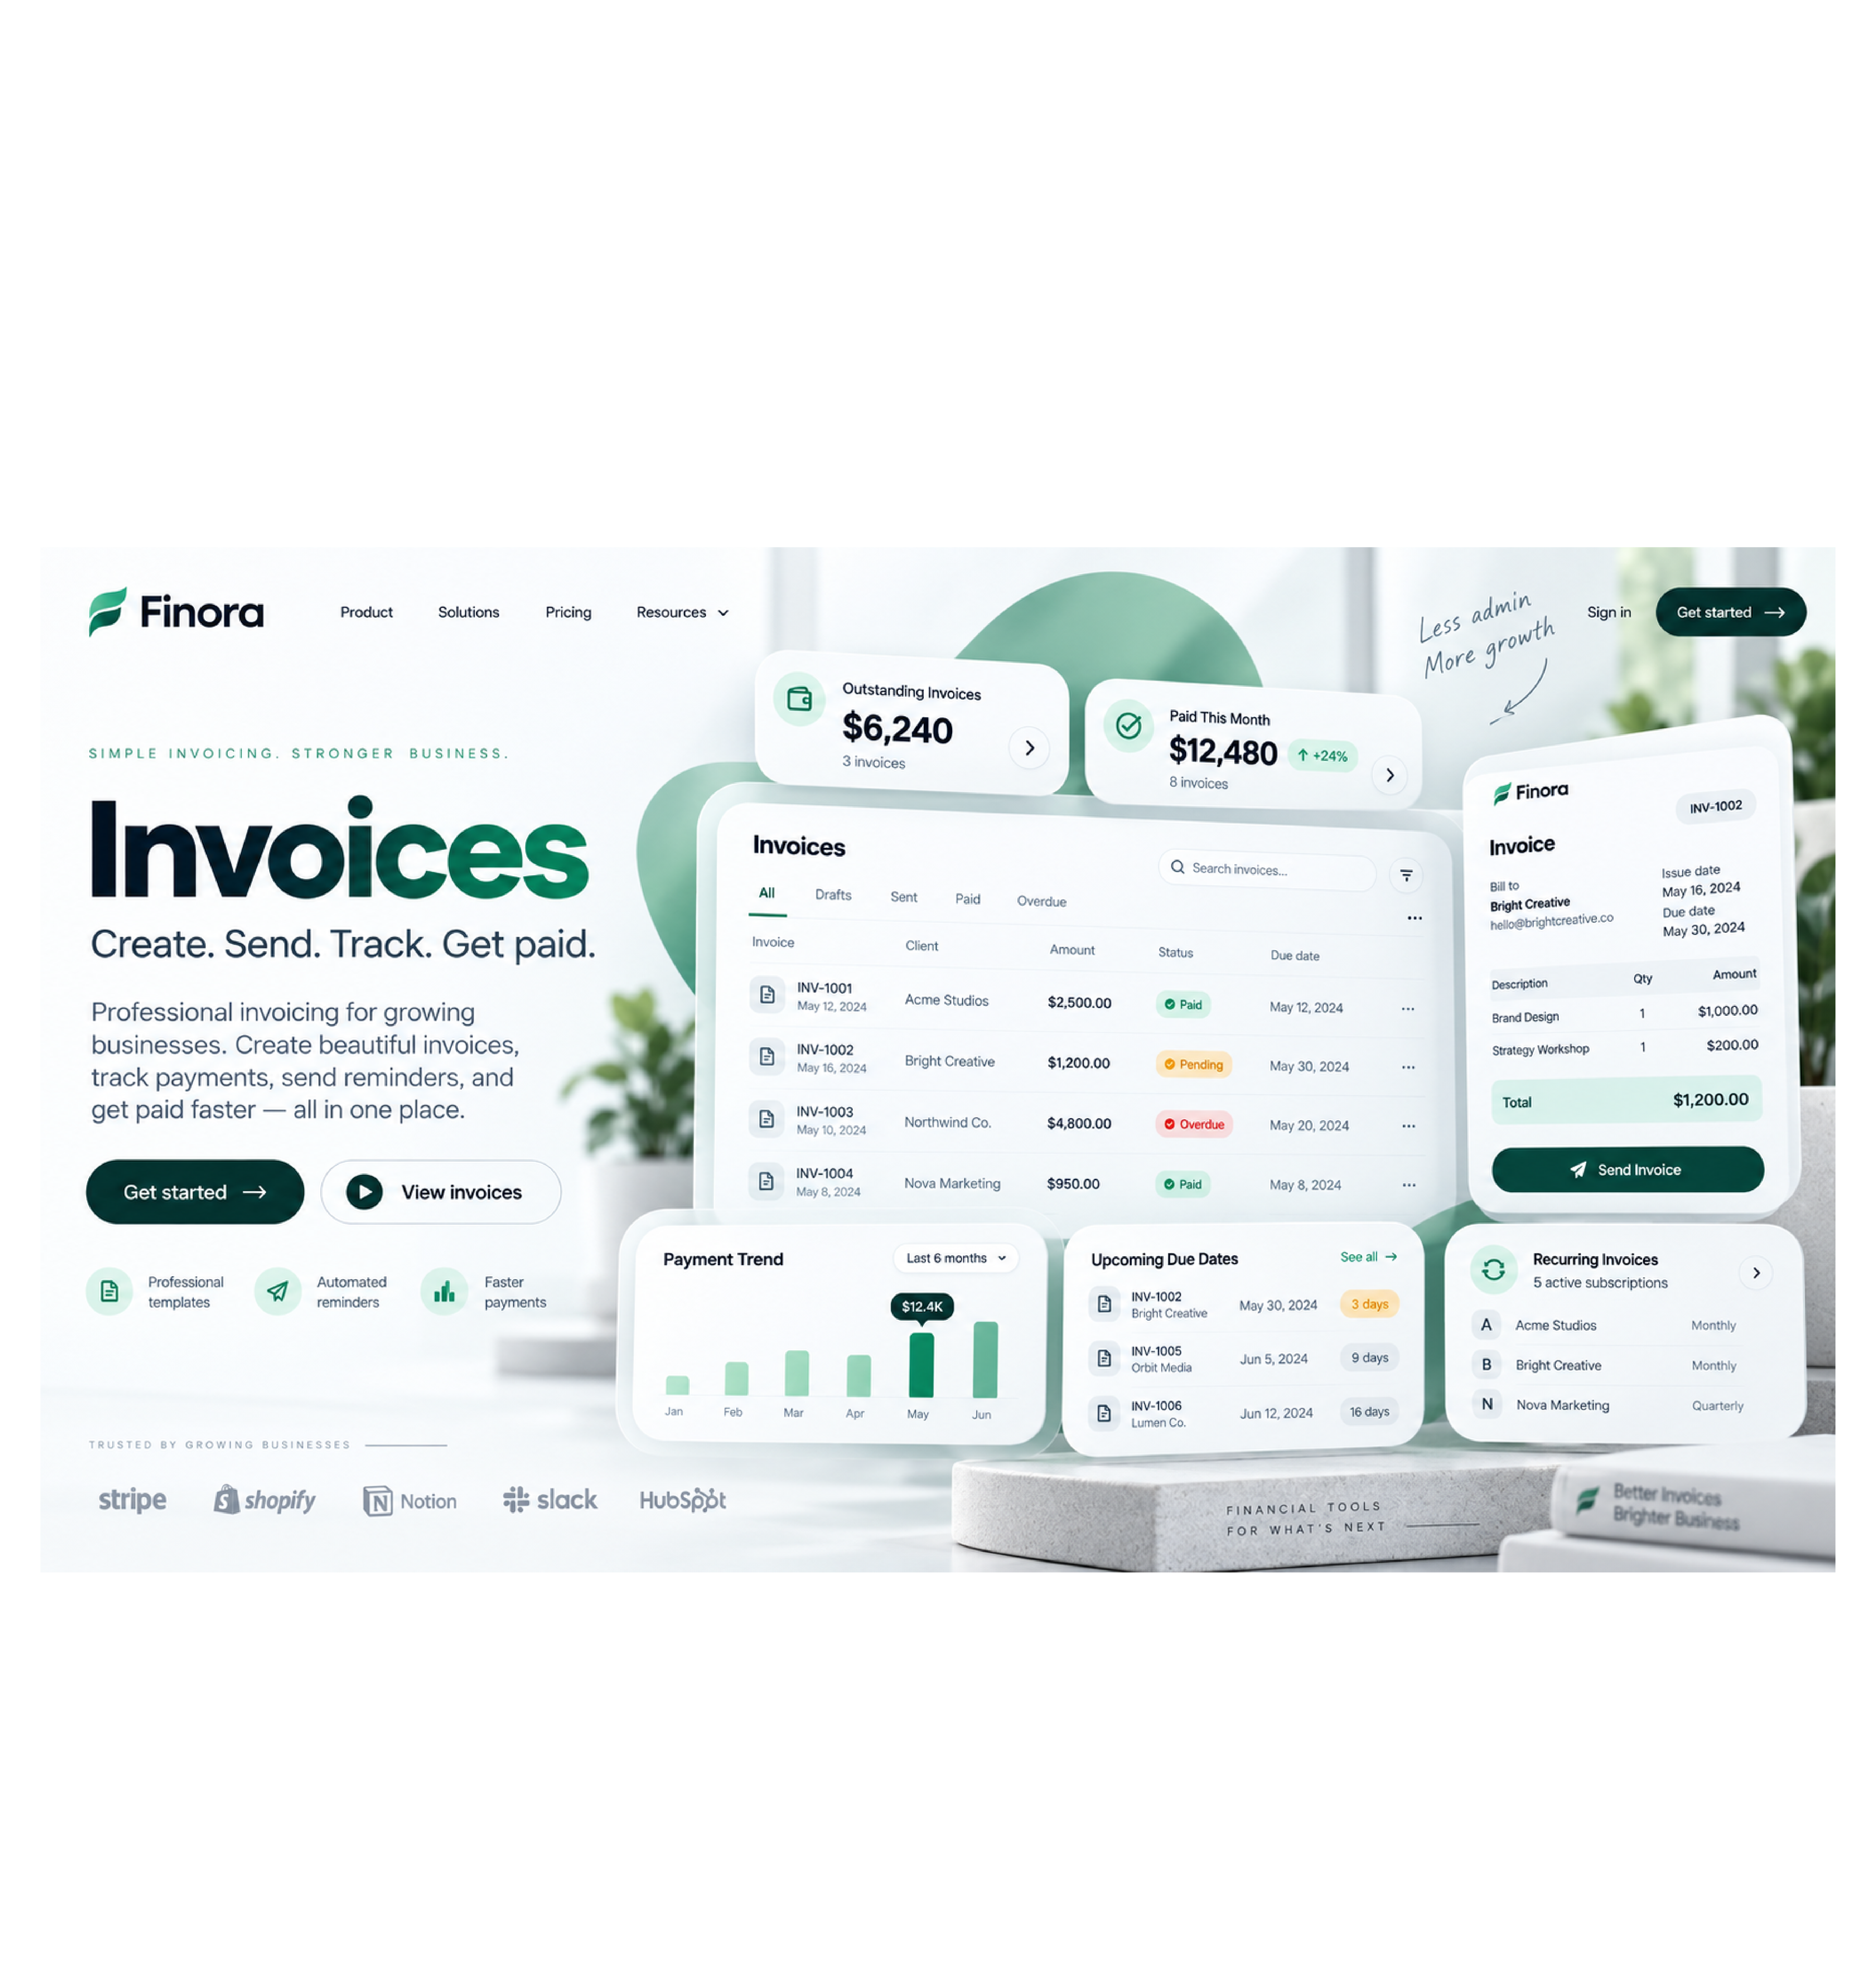
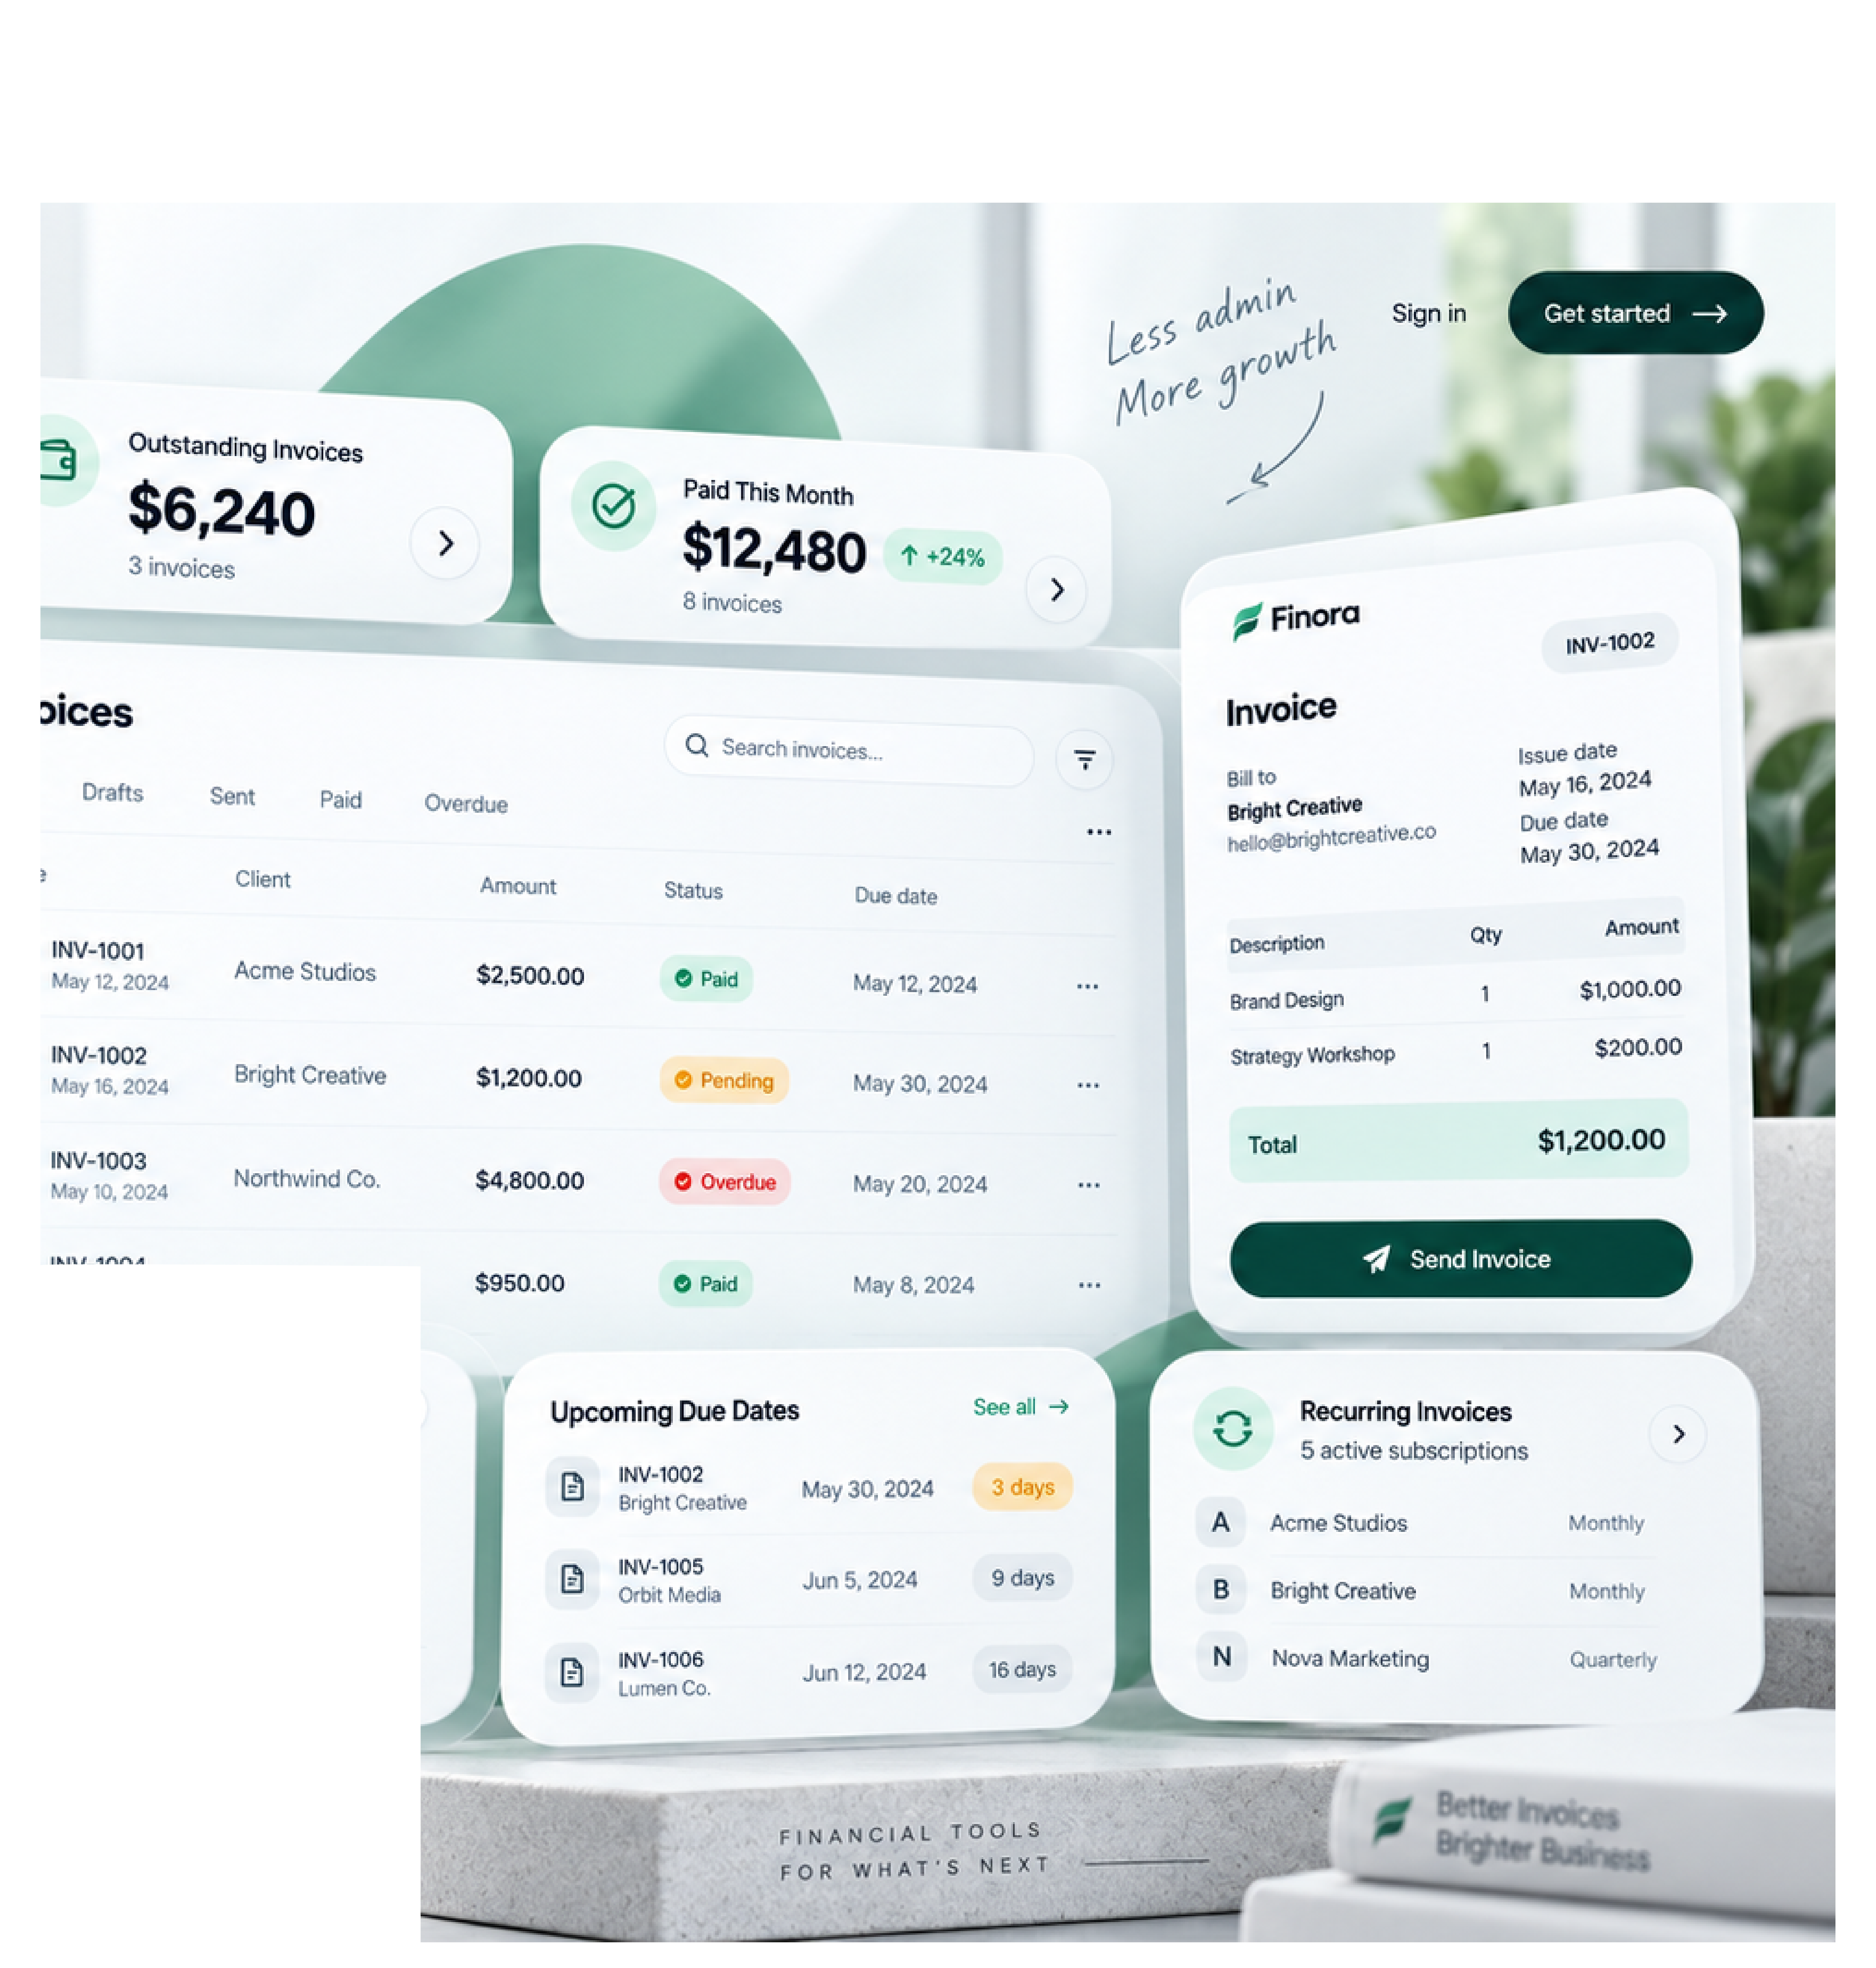
Finora is a modern Business Intelligence SaaS platform built to help businesses make smarter, data-driven decisions with ease. We believe that powerful insights should be simple, fast, and accessible to everyone not just data experts. Our platform combines real-time dashboards, advanced analytics, and intuitive reporting tools so companies can track performance, uncover opportunities, and stay ahead in a competitive market. Whether you’re a growing startup or an established enterprise, Finora turns complex data into clear, actionable intelligence. At Finora, our mission is simple: empower businesses with the clarity and confidence they need to grow. We are committed to delivering reliable, user-friendly solutions that help you focus on what matters most your success.
Revenue charts
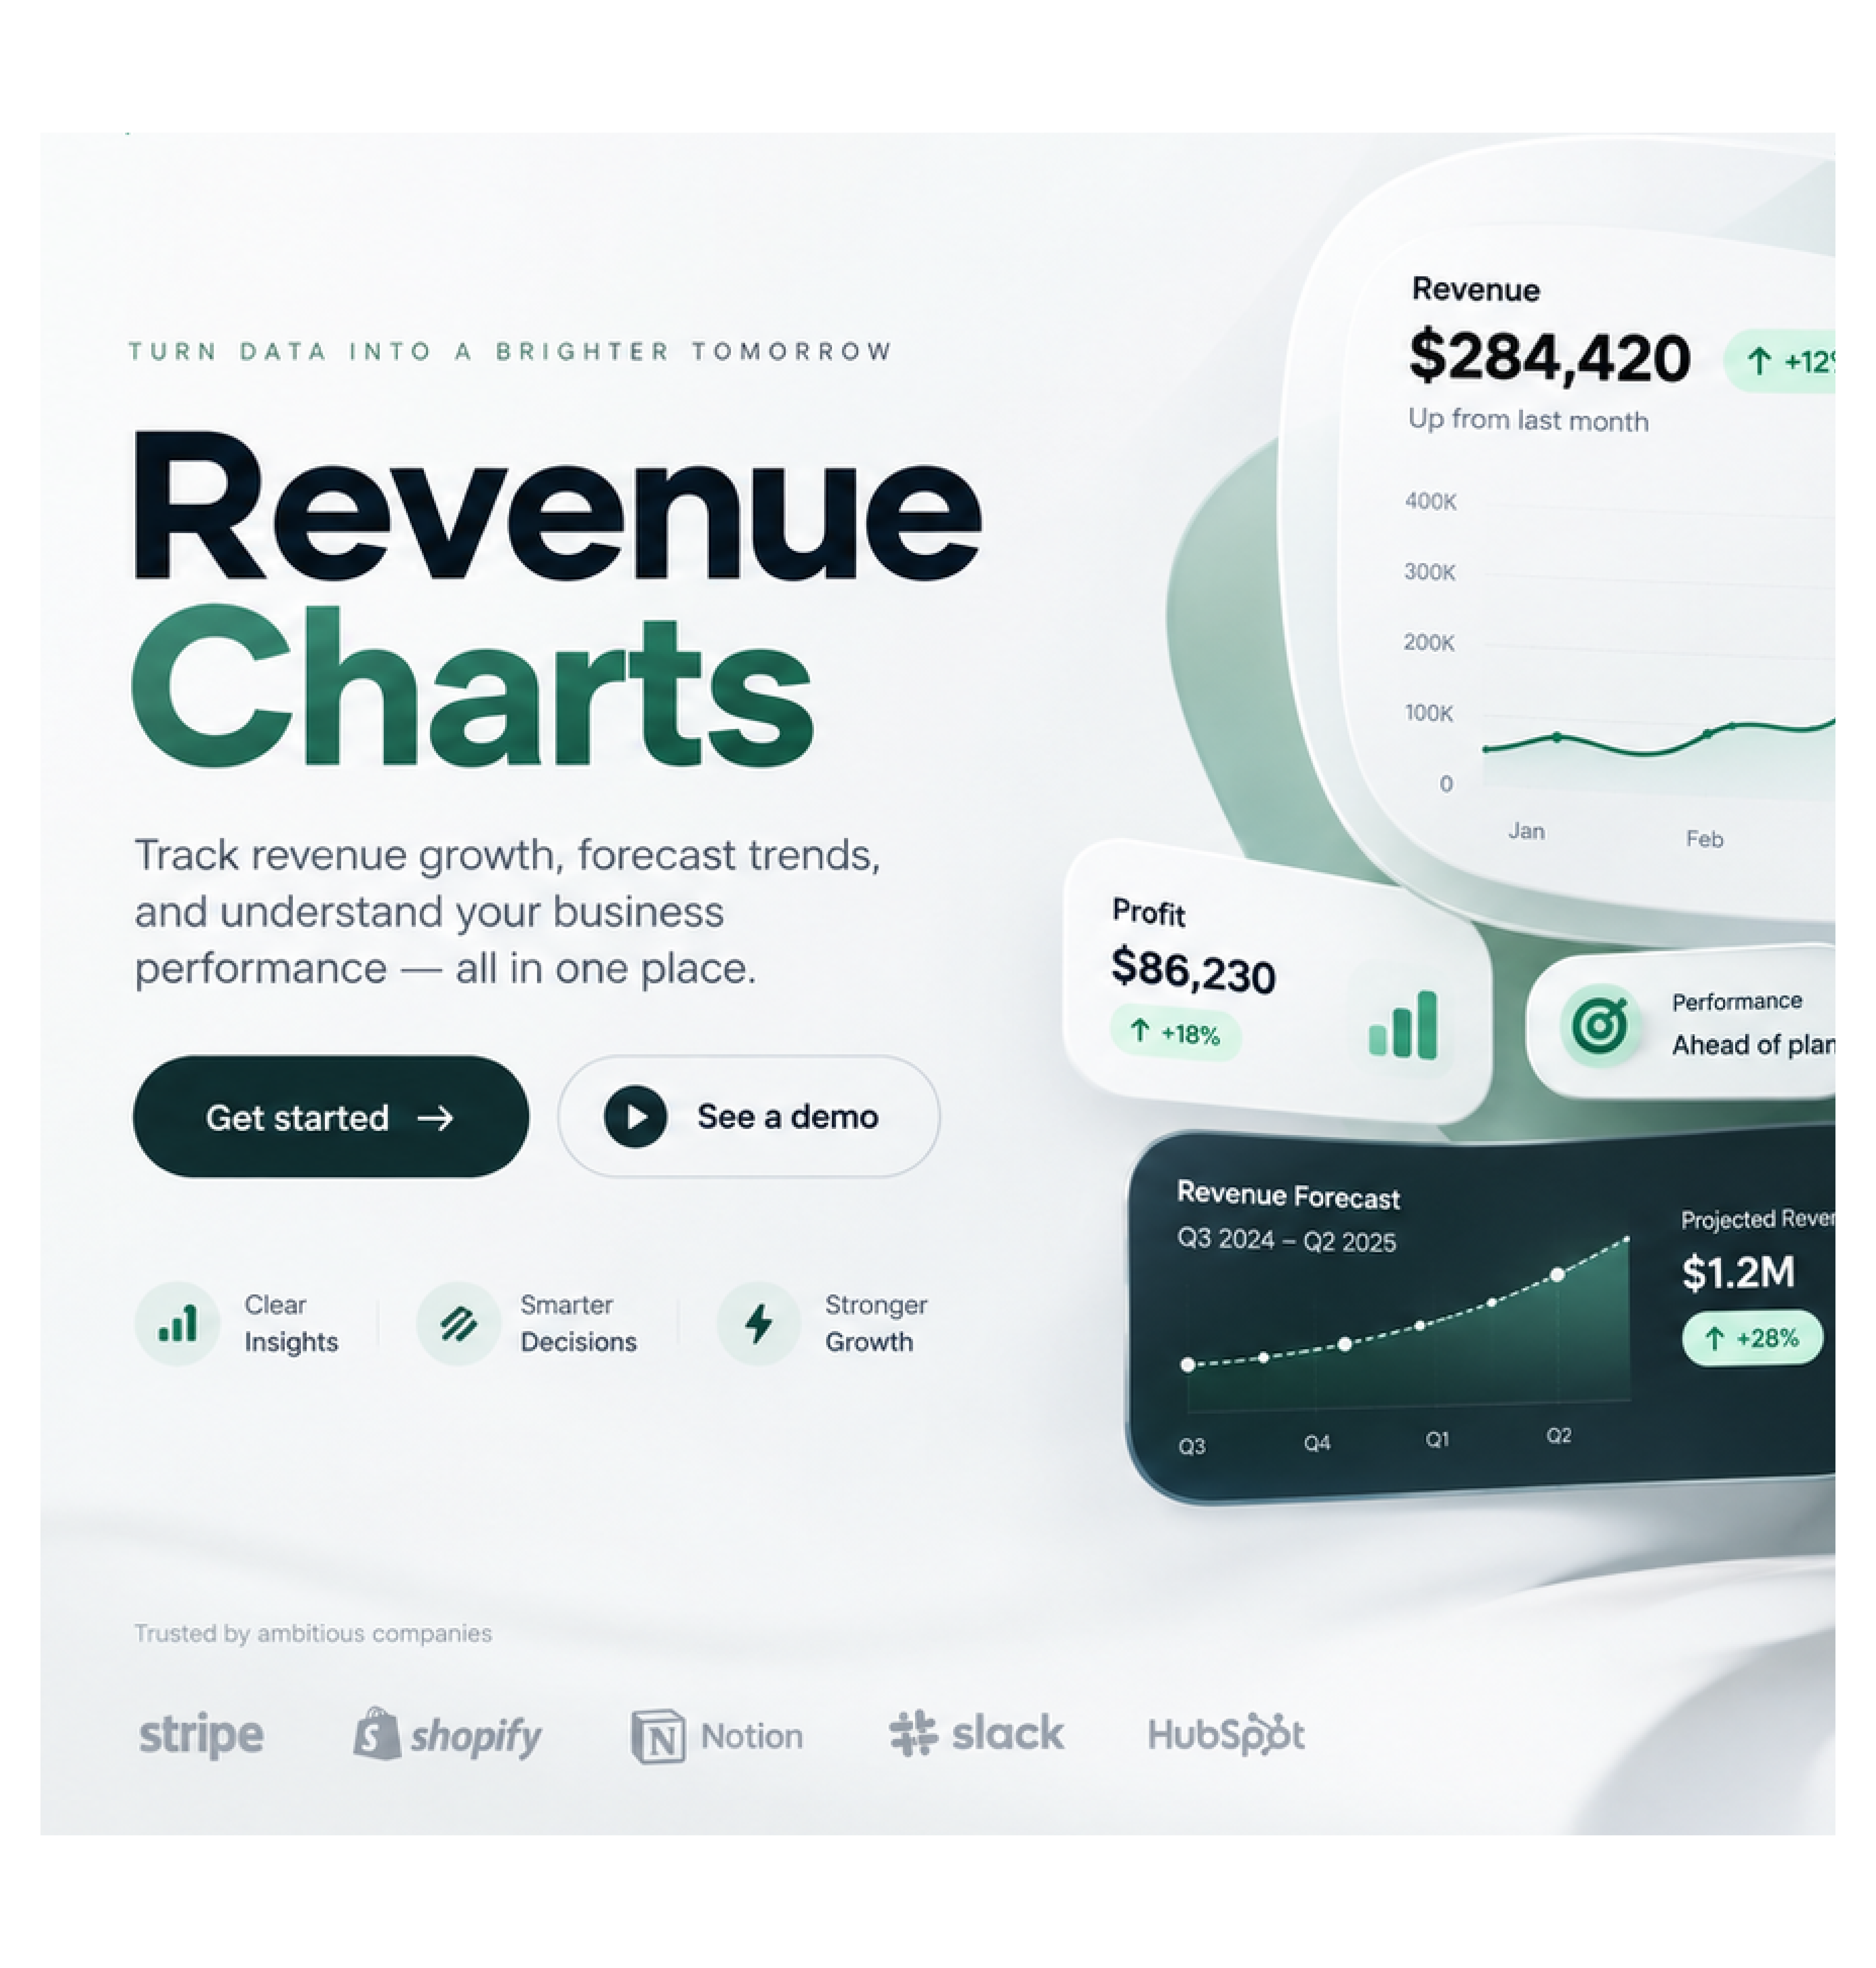
Finora’s Revenue Charts give you a clear and visual breakdown of your company’s earnings. Track monthly, quarterly, and yearly revenue trends with interactive charts that highlight growth patterns, peak periods, and performance gaps. Instantly compare revenue across products, regions, or channels so you can quickly identify what’s driving your income and where improvements are needed. With real-time updates and easy-to-read visuals, Finora helps you stay on top of your revenue and make smarter business decisions.
Expense tracking
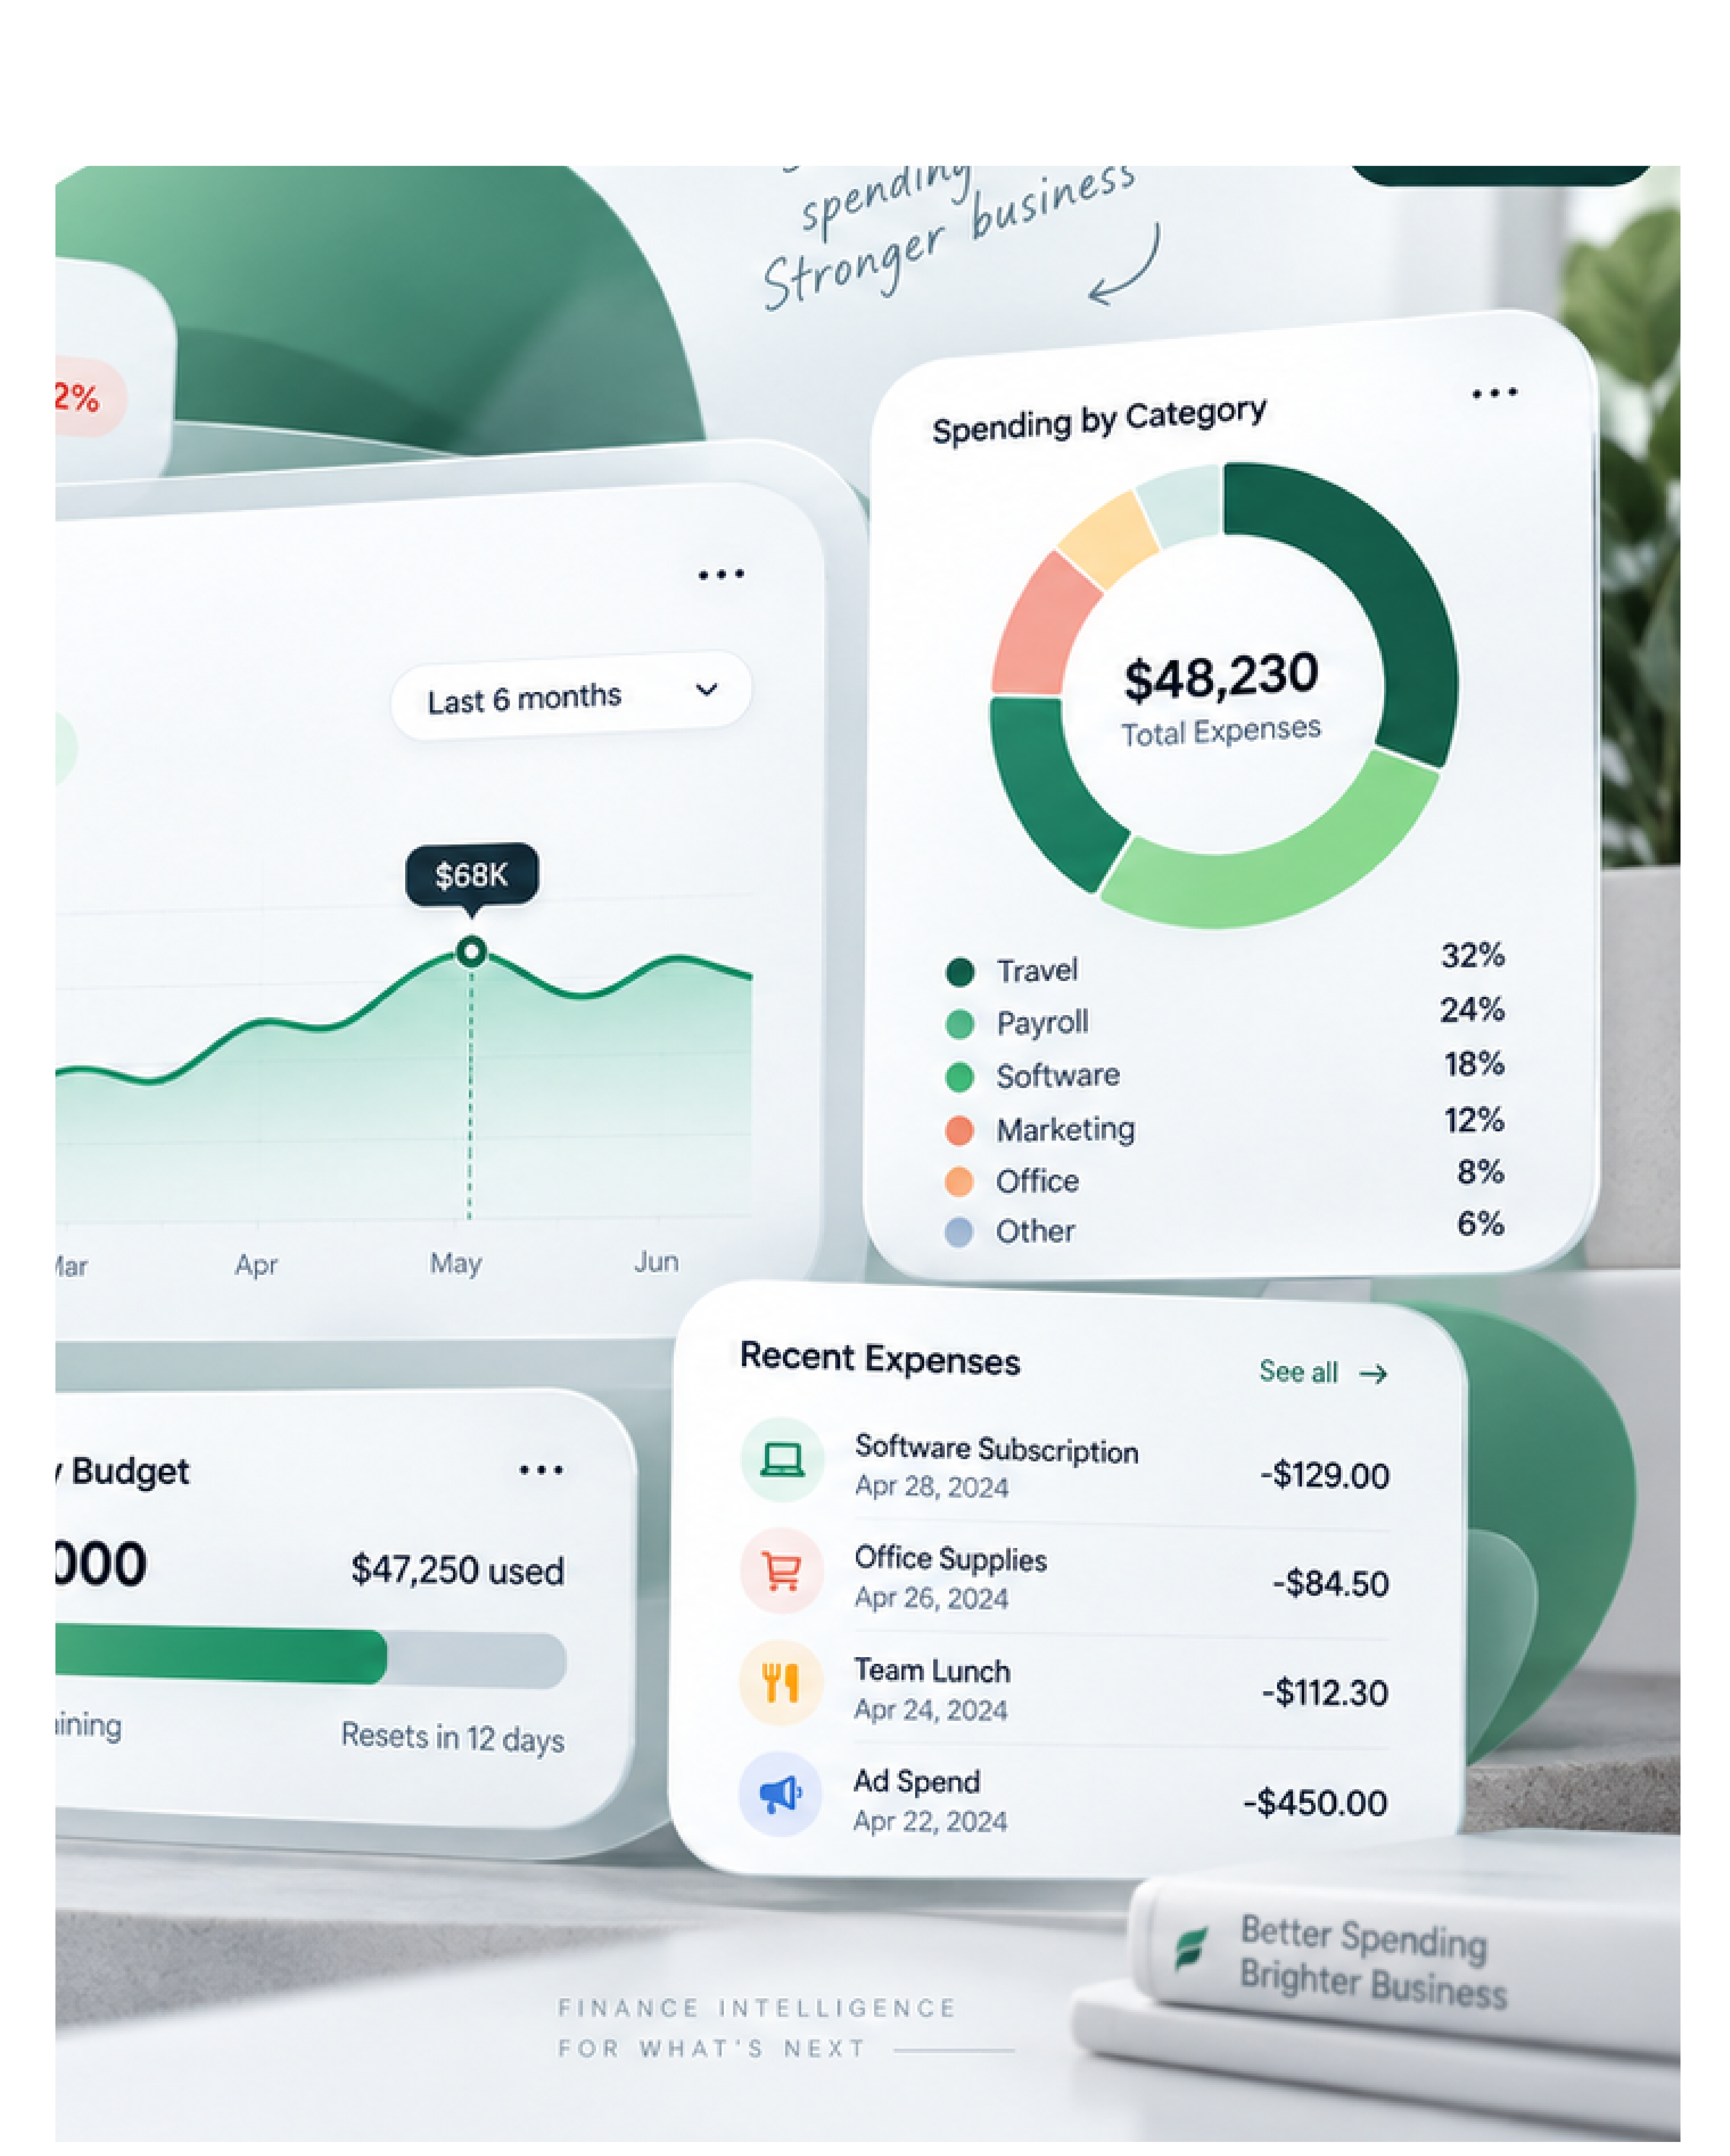
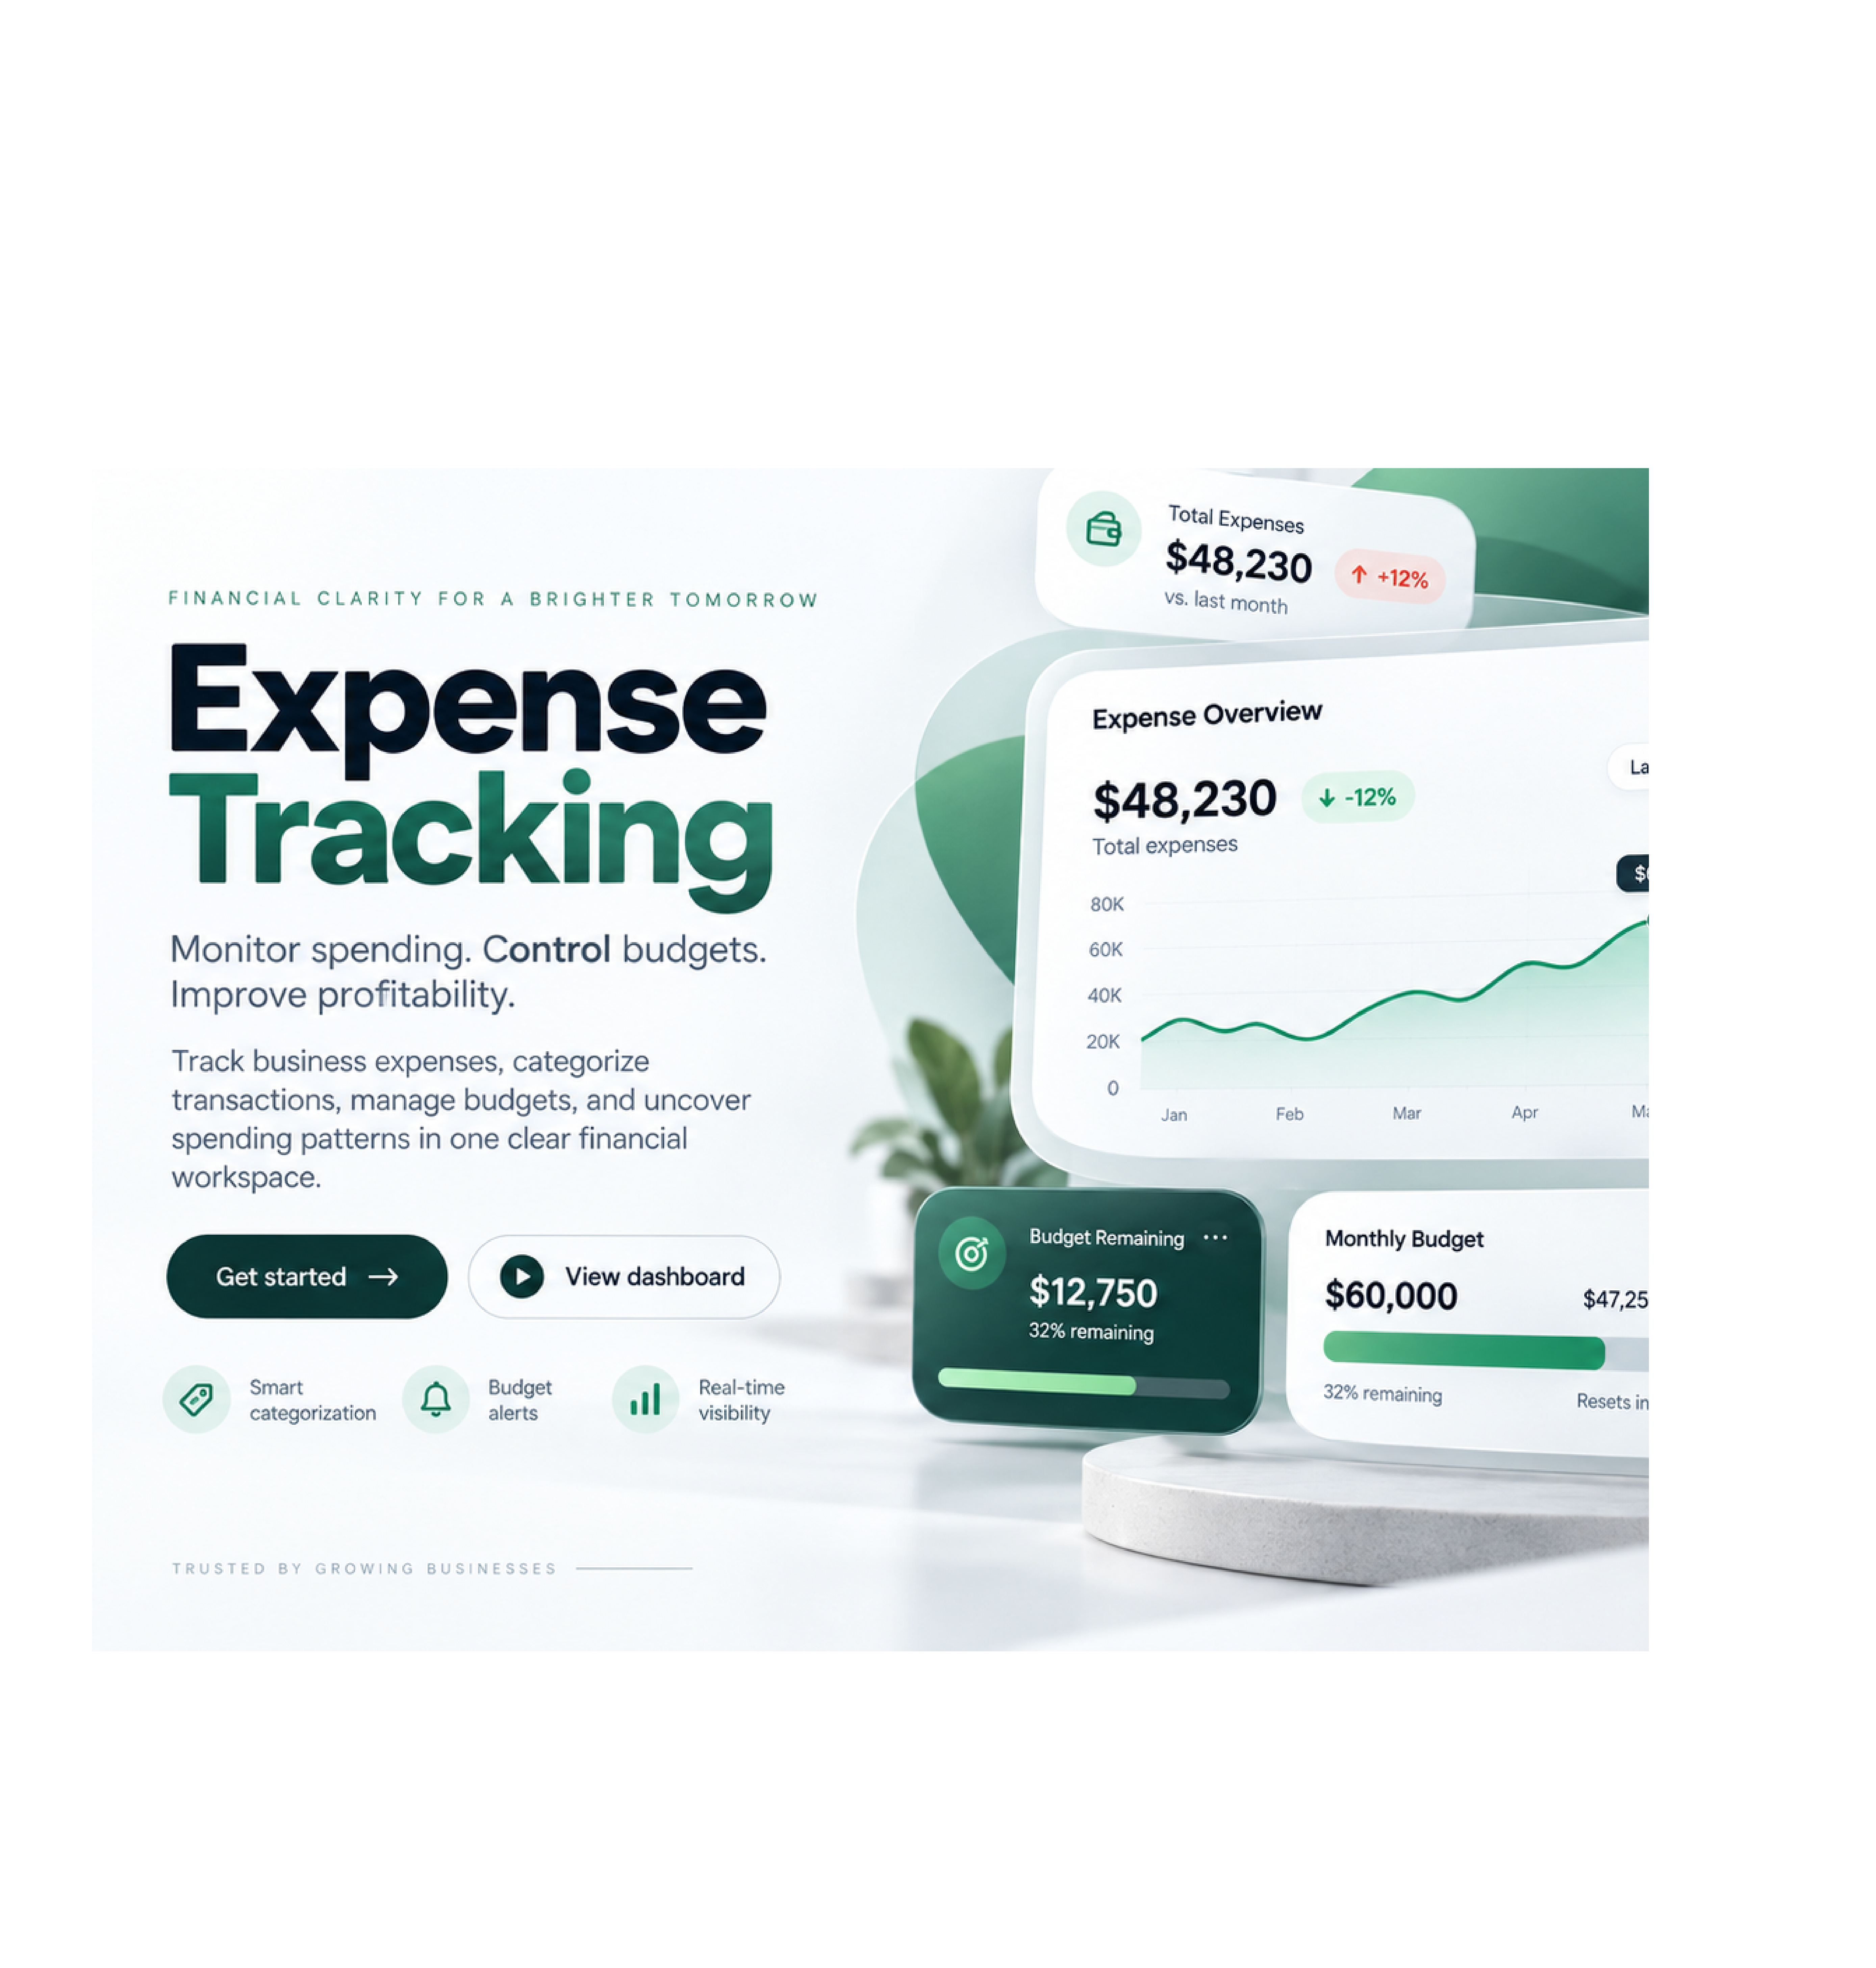
Finora’s Expense Tracking feature gives you complete control over your business spending. Monitor every expense in real time, categorize costs, and view clear breakdowns across departments, projects, or time periods. Interactive charts and alerts help you quickly spot overspending, identify cost-saving opportunities, and keep your budget on track. With Finora, managing expenses becomes simple, transparent, and efficient so you can focus on growing your business instead of chasing receipts.
KPI cards
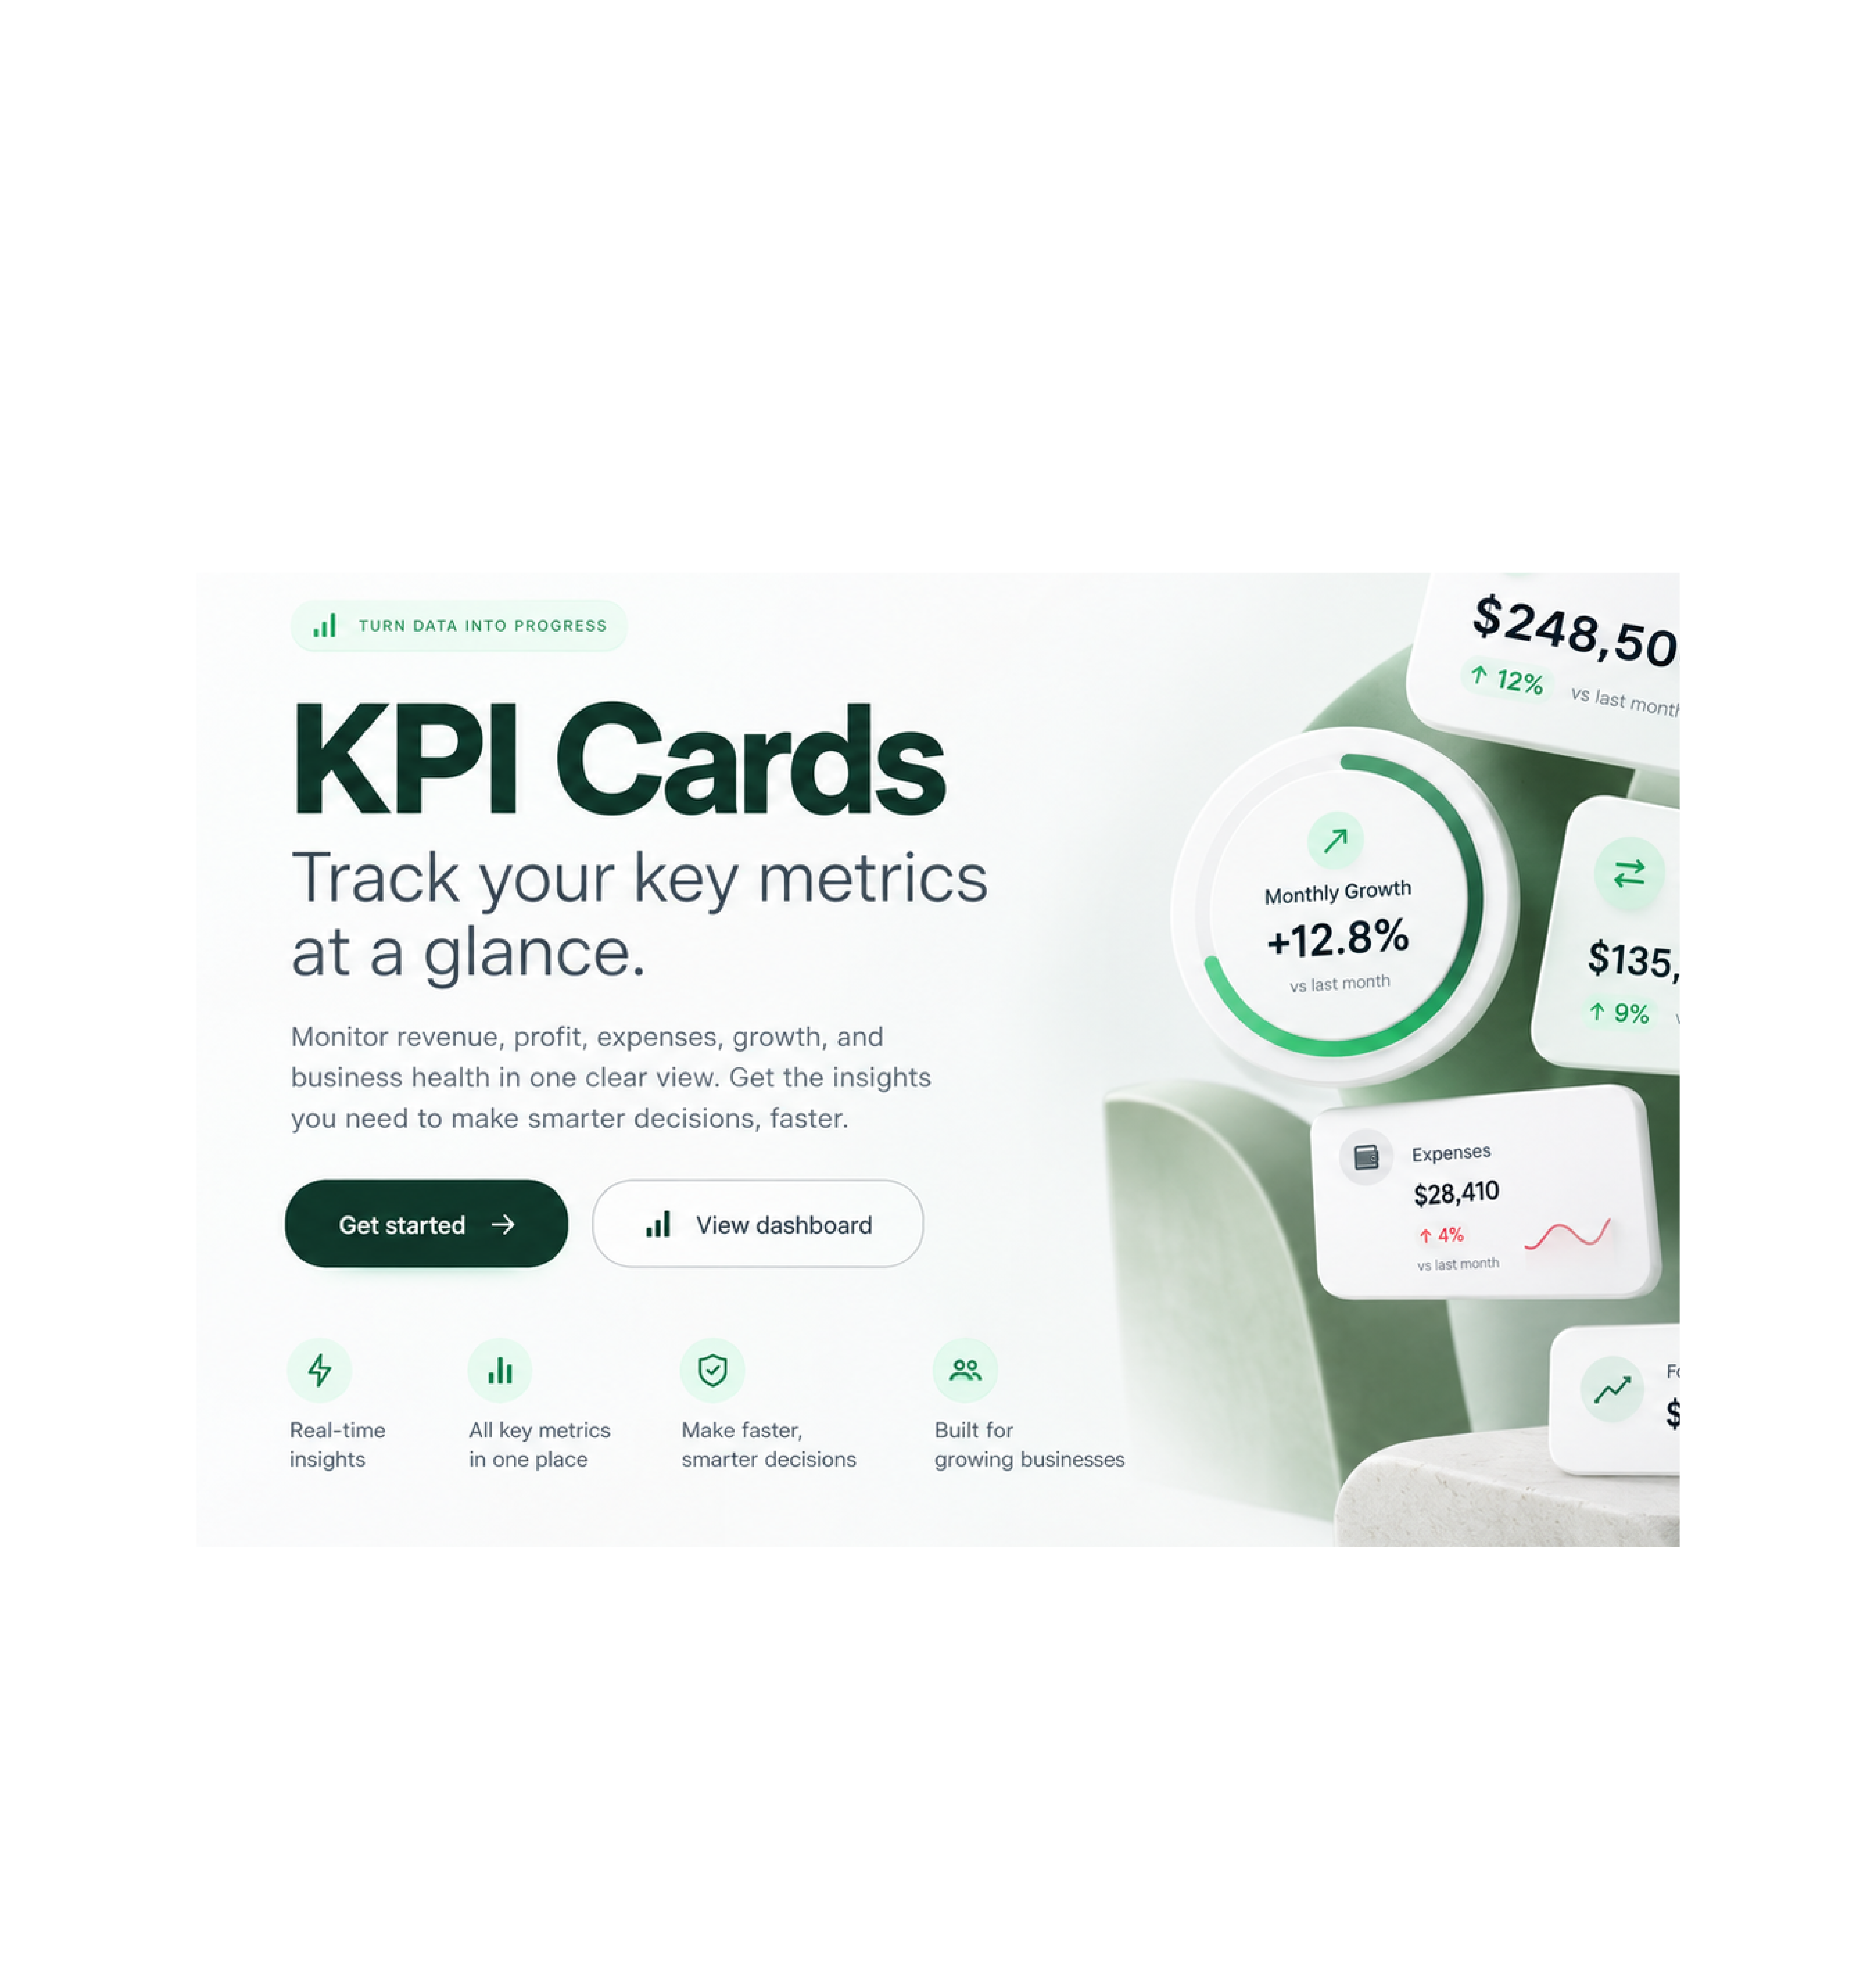
Finora’s KPI Cards display your most important business metrics at a glance. Track key performance indicators like revenue growth, profit margins, customer acquisition, and operational efficiency through clean, real-time cards. Each card updates automatically and highlights trends with clear visuals, so you can instantly see what’s performing well and what needs attention. With Finora’s KPI Cards, you stay focused on the numbers that matter most and make faster, smarter decisions every day.
Data visualization
Finora’s Data Visualization tools turn complex data into clear, interactive visuals that anyone can understand. From colorful charts and graphs to dynamic maps and heatmaps, you can explore trends, patterns, and insights in a visually engaging way. Customize views, filter information, and dive deeper into your data with just a few clicks. With Finora, raw numbers become powerful stories that help your team make faster, more confident decisions.
Want to know more? We're just a call away.
Receive the best brand consultancy by simply giving us a call.